
Page 15 - Read Online
P. 15
Lu et al. J Mater Inf 2022;2:11 I http://dx.doi.org/10.20517/jmi.2022.15 Page 11 of 18
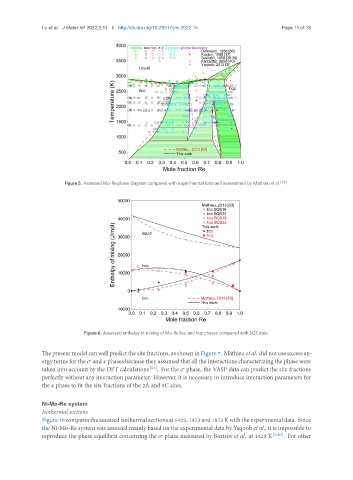
Figure 5. Assessed Mo-Re phase diagram compared with experimental data and assessment by Mathieu et al. [53] .
Figure 6. Assessed enthalpy of mixing of Mo-Re bcc and hcp phases compared with SQS data.
The present model can well predict the site fractions, as shown in Figure 7. Mathieu et al. did not use excess en-
ergy terms for the and phases because they assumed that all the interactions characterizing the phase were
taken into account by the DFT calculations [53] . For the phase, the VASP data can predict the site fractions
perfectly without any interaction parameter. However, it is necessary to introduce interaction parameters for
the phase to fit the site fractions of the 2A and 8C sites.
NiMoRe system
Isothermal sections
Figure10comparestheassessedisothermalsectionsat1425,1473and1873Kwiththeexperimentaldata. Since
the Ni-Mo-Re system was assessed mainly based on the experimental data by Yaqoob et al., it is impossible to
reproduce the phase equilibria concerning the phase measured by Borisov et al. at 1425 K [3,42] . For other