
Page 13 - Read Online
P. 13
Lu et al. J Mater Inf 2022;2:11 I http://dx.doi.org/10.20517/jmi.2022.15 Page 9 of 18
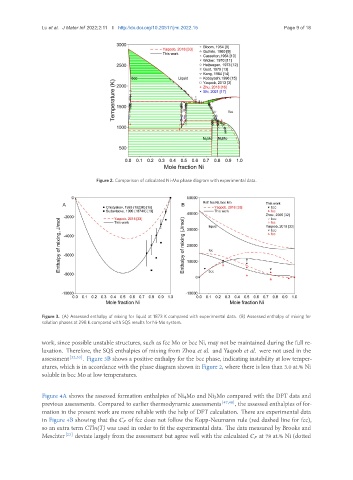
Figure 2. Comparison of calculated Ni-Mo phase diagram with experimental data.
Figure 3. (A) Assessed enthalpy of mixing for liquid at 1873 K compared with experimental data. (B) Assessed enthalpy of mixing for
solution phases at 298 K compared with SQS results for Ni-Mo system.
work, since possible unstable structures, such as fcc Mo or bcc Ni, may not be maintained during the full re-
laxation. Therefore, the SQS enthalpies of mixing from Zhou et al. and Yaqoob et al. were not used in the
assessment [32,33] . Figure 3B shows a positive enthalpy for the bcc phase, indicating instability at low temper-
atures, which is in accordance with the phase diagram shown in Figure 2, where there is less than 3.0 at.% Ni
soluble in bcc Mo at low temperatures.
Figure 4A shows the assessed formation enthalpies of Ni 4Mo and Ni 3Mo compared with the DFT data and
previous assessments. Compared to earlier thermodynamic assessments [47,48] , the assessed enthalpies of for-
mation in the present work are more reliable with the help of DFT calculation. There are experimental data
in Figure 4B showing that the of fcc does not follow the Kopp-Neumann rule (red dashed line for fcc),
so an extra term CTln(T) was used in order to fit the experimental data. The data measured by Brooks and
Meschter [23] deviate largely from the assessment but agree well with the calculated at 78 at.% Ni (dotted