
Page 251 - Read Online
P. 251
Page 4 of 7 Mascarenhas et al. J Cancer Metastasis Treat 2020;6:23 I http://dx.doi.org/10.20517/2394-4722.2020.52
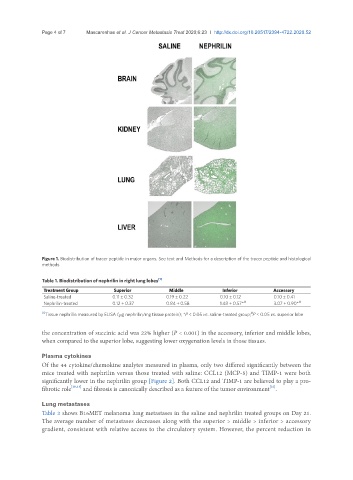
Figure 1. Biodistribution of tracer peptide in major organs. See text and Methods for a description of the tracer peptide and histological
methods
Table 1. Biodistribution of nephrilin in right lung lobes [1]
Treatment Group Superior Middle Inferior Accessory
Saline-treated 0.11 ± 0.32 0.19 ± 0.22 0.10 ± 0.12 0.10 ± 0.41
Nephrilin-treated 0.12 ± 0.37 0.84 ± 0.58 1.48 ± 0.57* ,# 3.07 ± 0.90* ,#
#
[1] Tissue nephrilin measured by ELISA (μg nephrilin/mg tissue protein); *P < 0.05 vs. saline-treated group; P < 0.05 vs. superior lobe
the concentration of succinic acid was 22% higher (P < 0.001) in the accessory, inferior and middle lobes,
when compared to the superior lobe, suggesting lower oxygenation levels in those tissues.
Plasma cytokines
Of the 44 cytokine/chemokine analytes measured in plasma, only two differed significantly between the
mice treated with nephrilin versus those treated with saline: CCL12 (MCP-5) and TIMP-1 were both
significantly lower in the nephrilin group [Figure 2]. Both CCL12 and TIMP-1 are believed to play a pro-
[22]
fibrotic role [20,21] and fibrosis is canonically described as a feature of the tumor environment .
Lung metastases
Table 2 shows B16MET melanoma lung metastases in the saline and nephrilin treated groups on Day 21.
The average number of metastases decreases along with the superior > middle > inferior > accessory
gradient, consistent with relative access to the circulatory system. However, the percent reduction in