
Page 837 - Read Online
P. 837
Wickremesekera et al. J Cancer Metastasis Treat 2019;5:62 I http://dx.doi.org/10.20517/2394-4722.2019.09 Page 5 of 9
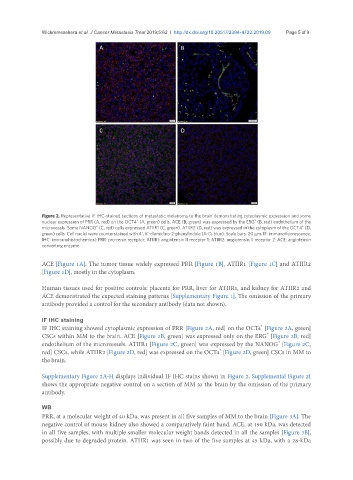
Figure 2. Representative IF IHC-stained sections of metastatic melanoma to the brain demonstrating cytoplasmic expression and some
+
+
nuclear expression of PRR (A, red) on the OCT4 (A, green) cells. ACE (B, green) was expressed by the ERG (B, red) endothelium of the
+
microvessls. Some NANOG (C, red) cells expressed ATIIR1 (C, green). ATIIR2 (D, red) was expressed in the cytoplasm of the OCT4 (D,
+
green) cells. Cell nuclei were counterstained with 4’, 6’-diamidino-2-phenylindole (A-D, blue). Scale bars: 20 μm. IF: immunofluorescence;
IHC: immunohistochemical; PRR: pro-renin receptor; ATIIR1: angiotensin II receptor 1; ATIIR2: angiotensin II receptor 2; ACE: angiotensin
converting enzyme
ACE [Figure 1A]. The tumor tissue widely expressed PRR [Figure 1B], ATIIR1 [Figure 1C] and ATIIR2
[Figure 1D], mostly in the cytoplasm.
Human tissues used for positive controls: placenta for PRR, liver for ATIIR1, and kidney for ATIIR2 and
ACE demonstrated the expected staining patterns [Supplementary Figure 1]. The omission of the primary
antibody provided a control for the secondary antibody (data not shown).
IF IHC staining
+
IF IHC staining showed cytoplasmic expression of PRR [Figure 2A, red] on the OCT4 [Figure 2A, green]
+
CSCs within MM to the brain. ACE [Figure 2B, green] was expressed only on the ERG [Figure 2B, red]
+
endothelium of the microvessels. ATIIR1 [Figure 2C, green] was expressed by the NANOG [Figure 2C,
+
red] CSCs, while ATIIR2 [Figure 2D, red] was expressed on the OCT4 [Figure 2D, green] CSCs in MM to
the brain.
Supplementary Figure 2A-H displays individual IF IHC stains shown in Figure 2. Supplemental Figure 2I
shows the appropriate negative control on a section of MM to the brain by the omission of the primary
antibody.
WB
PRR, at a molecular weight of 40 kDa, was present in all five samples of MM to the brain [Figure 3A]. The
negative control of mouse kidney also showed a comparatively faint band. ACE, at 190 kDa, was detected
in all five samples, with multiple smaller molecular weight bands detected in all the samples [Figure 3B],
possibly due to degraded protein. ATIIR1 was seen in two of the five samples at 45 kDa, with a 28-kDa