
Page 789 - Read Online
P. 789
Page 4 of 9 Zhang et al. J Cancer Metastasis Treat 2019;5:56 I http://dx.doi.org/10.20517/2394-4722.2018.112
35
A
30
SA-MIP binding (%) 20
25
15
10
5
0
SA-MIP s 0.02 mg/ml SA-MIP s 0.04 mg/ml SA-MIP s 0.08 mg/ml
RAW 264.7 MCF-7
B
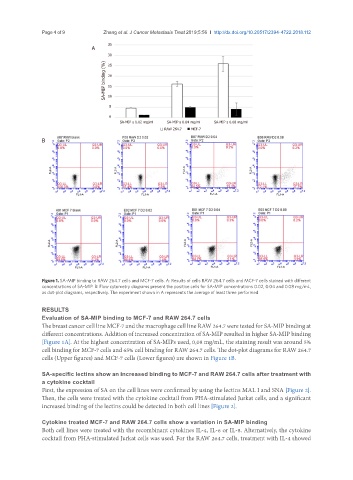
Figure 1. SA-MIP binding to RAW 264.7 cells and MCF-7 cells. A: Results of cells RAW 264.7 cells and MCF-7 cells stained with different
concentrations of SA-MIP. B: Flow cytometry diagrams present the positive cells for SA-MIP concentrations 0.02, 0.04 and 0.08 mg/mL,
as dot-plot diagrams, respectively. The experiment shown in A represents the average of least three performed
RESULTS
Evaluation of SA-MIP binding to MCF-7 and RAW 264.7 cells
The breast cancer cell line MCF-7 and the macrophage cell line RAW 264.7 were tested for SA-MIP binding at
different concentrations. Addition of increased concentration of SA-MIP resulted in higher SA-MIP binding
[Figure 1A]. At the highest concentration of SA-MIPs used, 0,08 mg/mL, the staining result was around 5%
cell binding for MCF-7 cells and 65% cell binding for RAW 264.7 cells. The dot-plot diagrams for RAW 264.7
cells (Upper figures) and MCF-7 cells (Lower figures) are shown in Figure 1B.
SA-specific lectins show an increased binding to MCF-7 and RAW 264.7 cells after treatment with
a cytokine cocktail
First, the expression of SA on the cell lines were confirmed by using the lectins MAL I and SNA [Figure 2].
Then, the cells were treated with the cytokine cocktail from PHA-stimulated Jurkat cells, and a significant
increased binding of the lectins could be detected in both cell lines [Figure 2].
Cytokine treated MCF-7 and RAW 264.7 cells show a variation in SA-MIP binding
Both cell lines were treated with the recombinant cytokines IL-4, IL-6 or IL-8. Alternatively, the cytokine
cocktail from PHA-stimulated Jurkat cells was used. For the RAW 264.7 cells, treatment with IL-4 showed