
Page 687 - Read Online
P. 687
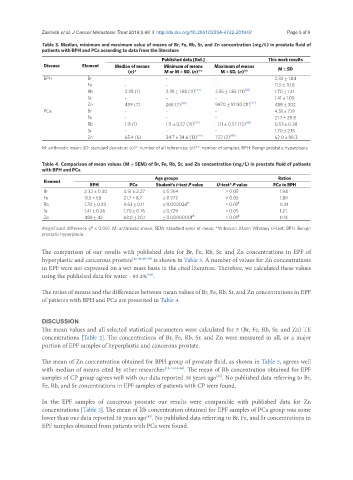
Zaichick et al. J Cancer Metastasis Treat 2019;5:48  I  http://dx.doi.org/10.20517/2394-4722.2019.07                           Page 5 of 9

               Table 3. Median, minimum and maximum value of means of Br, Fe, Rb, Sr, and Zn concentration (mg/L) in prostate fluid of
               patients with BPH and PCa according to data from the literature
                                                        Published data [Ref.]              This work results
                Disease      Element    Median of means  Minimum of means   Maximum of means   M ± SD
                                            (n)*        M or M ± SD, (n)**  M ± SD, (n)**
                BPH            Br          -             -                -                   2.32 ± 1.84
                               Fe          -             -                -                   11.5 ± 10.8
                               Rb          2.35 (1)      2.35 ± 1.85 (11) [43]  2.35 ± 1.85 (11) [43]  1.70 ± 1.41
                               Sr          -             -                -                   1.41 ± 1.09
                               Zn          459 (7)       268 (7) [46]     9870 ± 10130 (11) [47]  488 ± 302
                PCa            Br          -             -                -                   4.51 ± 7.19
                               Fe          -             -                -                   21.7 ± 28.8
                               Rb          1.11 (1)      1.11 ± 0.57 (15) [43]  . 1.11 ± 0.57 (15) [43]  0.53 ± 0.38
                               Sr          -             -                -                   1.70 ± 2.15
                               Zn          65.4 (6)      34.7 ± 34.6 (13) [44]  722 (3) [49]  62.0 ± 98.3
               M: arithmetic mean; SD: standard deviation; (n)*: number of all references; (n)**: number of samples; BPH: Benign prostatic hyperplasia


               Table 4. Comparison of mean values (M ± SEM) of Br, Fe, Rb, Sr, and Zn concentration (mg/L) in prostate fluid of patients
               with BPH and PCa
                                                     Age groups                                Ratios
                Element
                               BPH           PCa      Student’s t-test P value  U-test* P value  PCa to BPH
                Br           2.32 ± 0.30   4.51 ± 2.27  ≤ 0.364              > 0.05            1.94
                Fe           11.5 ± 1.8    21.7 ± 8.7   ≤ 0.272              > 0.05            1.89
                Rb           1.70 ± 0.23   0.53 ± 0.11  ≤ 0.000024 #         < 0.01 #          0.31
                Sr           1.41 ± 0.26   1.70 ± 0.76  ≤ 0.729              > 0.05            1.21
                Zn           488 ± 42      62.0 ± 20.1  ≤ 0.00000001 #       < 0.01 #          0.13
               #significant difference (P ≤ 0.05). M: arithmetic mean; SEM: standard error of mean; *Wilcoxon: Mann Whitney U-test; BPH: Benign
               prostatic hyperplasia

               The comparison of our results with published data for Br, Fe, Rb, Sr, and Zn concentrations in EPF of
               hyperplastic and cancerous prostate [41-44,46-50]  is shown in Table 3. A number of values for Zn concentrations
               in EPF were not expressed on a wet mass basis in the cited literature. Therefore, we calculated these values
               using the published data for water - 93.2% .
                                                   [50]
               The ratios of means and the differences between mean values of Br, Fe, Rb, Sr, and Zn concentrations in EPF
               of patients with BPH and PCa are presented in Table 4.


               DISCUSSION
               The mean values and all selected statistical parameters were calculated for 5 (Br, Fe, Rb, Sr, and Zn) TE
               concentrations [Table 2]. The concentrations of Br, Fe, Rb, Sr, and Zn were measured in all, or a major
               portion of EPF samples of hyperplastic and cancerous prostate.

               The mean of Zn concentration obtained for BPH group of prostate fluid, as shown in Table 3, agrees well
               with median of means cited by other researches [41-44,46-50] . The mean of Rb concentration obtained for EPF
               samples of CP group agrees well with our data reported 38 years ago . No published data referring to Br,
                                                                          [43]
               Fe, Rb, and Sr concentrations in EPF samples of patients with CP were found.

               In the EPF samples of cancerous prostate our  results were comparable with published data for Zn
               concentrations [Table 3]. The mean of Rb concentration obtained for EPF samples of PCa group was some
               lower than our data reported 38 years ago . No published data referring to Br, Fe, and Sr concentrations in
                                                  [43]
               EPF samples obtained from patients with PCa were found.