
Page 686 - Read Online
P. 686
Page 4 of 9 Zaichick et al. J Cancer Metastasis Treat 2019;5:48 I http://dx.doi.org/10.20517/2394-4722.2019.07
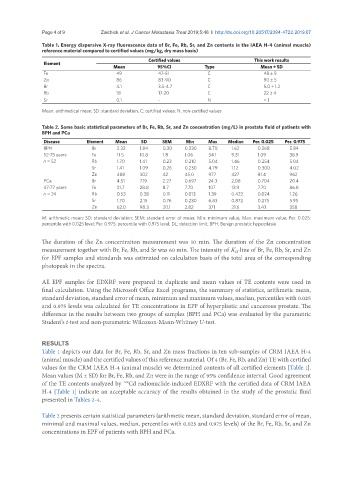
Table 1. Energy dispersive X-ray fluorescence data of Br, Fe, Rb, Sr, and Zn contents in the IAEA H-4 (animal muscle)
reference material compared to certified values (mg/kg, dry mass basis)
Certified values This work results
Element
Mean 95%CI Type Mean ± SD
Fe 49 47-51 C 48 ± 9
Zn 86 83-90 C 90 ± 5
Br 4.1 3.5-4.7 C 5.0 ± 1.2
Rb 18 17-20 C 22 ± 4
Sr 0.1 - N < 1
Mean: arithmetical mean; SD: standard deviation; C: certified values; N: non-certified values
Table 2. Some basic statistical parameters of Br, Fe, Rb, Sr, and Zn concentration (mg/L) in prostate fluid of patients with
BPH and PCa
Disease Element Mean SD SEM Min Max Median Per. 0.025 Per. 0.975
BPH Br 2.32 1.84 0.30 0.230 8.70 1.62 0.268 5.84
52-75 years Fe 11.5 10.8 1.8 1.06 54.1 9.31 1.09 38.9
n = 52 Rb 1.70 1.41 0.23 0.210 5.04 1.46 0.254 5.04
Sr 1.41 1.09 0.26 0.230 4.79 1.12 0.300 4.02
Zn 488 302 42 45.0 977 427 81.4 962
PCa Br 4.51 7.19 2.27 0.697 24.3 2.08 0.704 20.4
47-77 years Fe 21.7 28.8 8.7 7.70 107 13.9 7.70 86.8
n = 24 Rb 0.53 0.38 0.11 0.013 1.39 0.422 0.024 1.26
Sr 1.70 2.15 0.76 0.230 6.83 0.872 0.275 5.95
Zn 62.0 98.3 20.1 2.82 371 21.6 3.43 358
M: arithmetic mean; SD: standard deviation; SEM: standard error of mean; Min: minimum value; Max: maximum value; Per. 0.025:
percentile with 0.025 level; Per. 0.975: percentile with 0.975 level; DL: detection limit; BPH: Benign prostatic hyperplasia
The duration of the Zn concentration measurement was 10 min. The duration of the Zn concentration
measurement together with Br, Fe, Rb, and Sr was 60 min. The intensity of K a-line of Br, Fe, Rb, Sr, and Zn
for EPF samples and standards was estimated on calculation basis of the total area of the corresponding
photopeak in the spectra.
All EPF samples for EDXRF were prepared in duplicate and mean values of TE contents were used in
final calculation. Using the Microsoft Office Excel programs, the summary of statistics, arithmetic mean,
standard deviation, standard error of mean, minimum and maximum values, median, percentiles with 0.025
and 0.975 levels was calculated for TE concentrations in EPF of hyperplastic and cancerous prostate. The
difference in the results between two groups of samples (BPH and PCa) was evaluated by the parametric
Student’s t-test and non-parametric Wilcoxon-Mann-Whitney U-test.
RESULTS
Table 1 depicts our data for Br, Fe, Rb, Sr, and Zn mass fractions in ten sub-samples of CRM IAEA H-4
(animal muscle) and the certified values of this reference material. Of 4 (Br, Fe, Rb, and Zn) TE with certified
values for the CRM IAEA H-4 (animal muscle) we determined contents of all certified elements [Table 1].
Mean values (M ± SD) for Br, Fe, Rb, and Zn were in the range of 95% confidence interval. Good agreement
of the TE contents analyzed by Cd radionuclide-induced EDXRF with the certified data of CRM IAEA
109
H-4 [Table 1] indicate an acceptable accuracy of the results obtained in the study of the prostatic fluid
presented in Tables 2-4.
Table 2 presents certain statistical parameters (arithmetic mean, standard deviation, standard error of mean,
minimal and maximal values, median, percentiles with 0.025 and 0.975 levels) of the Br, Fe, Rb, Sr, and Zn
concentrations in EPF of patients with BPH and PCa.