
Page 200 - Read Online
P. 200
Page 6 of 13 Suominen et al. J Cancer Metastasis Treat 2019;5:14 I http://dx.doi.org/10.20517/2394-4722.2018.64
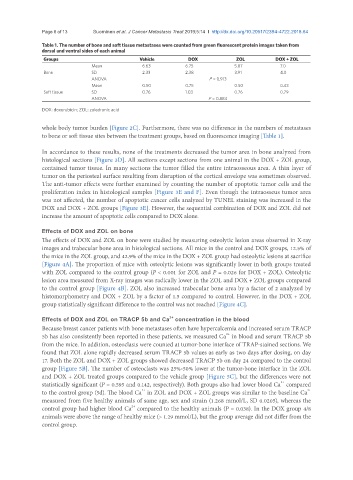
Table 1. The number of bone and soft tissue metastases were counted from green fluorescent protein images taken from
dorsal and ventral sides of each animal
Groups Vehicle DOX ZOL DOX + ZOL
Mean 6.63 6.75 5.87 7.0
Bone SD 2.33 2.38 3.91 4.0
ANOVA P = 0.913
Mean 0.50 0.75 0.50 0.43
Soft tissue SD 0.76 1.03 0.76 0.79
ANOVA P = 0.884
DOX: doxorubicin; ZOL: zoledronic acid
whole body tumor burden [Figure 2C]. Furthermore, there was no difference in the numbers of metastases
to bone or soft tissue sites between the treatment groups, based on fluorescence imaging [Table 1].
In accordance to these results, none of the treatments decreased the tumor area in bone analyzed from
histological sections [Figure 3D]. All sections except sections from one animal in the DOX + ZOL group,
contained tumor tissue. In many sections the tumor filled the entire intraosseous area. A thin layer of
tumor on the periosteal surface resulting from disruption of the cortical envelope was sometimes observed.
The anti-tumor effects were further examined by counting the number of apoptotic tumor cells and the
proliferation index in histological samples [Figure 3E and F]. Even though the intraosseus tumor area
was not affected, the number of apoptotic cancer cells analyzed by TUNEL staining was increased in the
DOX and DOX + ZOL groups [Figure 3E]. However, the sequential combination of DOX and ZOL did not
increase the amount of apoptotic cells compared to DOX alone.
Effects of DOX and ZOL on bone
The effects of DOX and ZOL on bone were studied by measuring osteolytic lesion areas observed in X-ray
images and trabecular bone area in histological sections. All mice in the control and DOX groups, 12.5% of
the mice in the ZOL group, and 42.9% of the mice in the DOX + ZOL group had osteolytic lesions at sacrifice
[Figure 4A]. The proportion of mice with osteolytic lesions was significantly lower in both groups treated
with ZOL compared to the control group (P < 0.001 for ZOL and P = 0.026 for DOX + ZOL). Osteolytic
lesion area measured from X-ray images was radically lower in the ZOL and DOX + ZOL groups compared
to the control group [Figure 4B]. ZOL also increased trabecular bone area by a factor of 2 analyzed by
histomorphometry and DOX + ZOL by a factor of 1.5 compared to control. However, in the DOX + ZOL
group statistically significant difference to the control was not reached [Figure 4C].
2+
Effects of DOX and ZOL on TRACP 5b and Ca concentration in the blood
Because breast cancer patients with bone metastases often have hypercalcemia and increased serum TRACP
5b has also consistently been reported in these patients, we measured Ca in blood and serum TRACP 5b
2+
from the mice. In addition, osteoclasts were counted at tumor-bone interface of TRAP-stained sections. We
found that ZOL alone rapidly decreased serum TRACP 5b values as early as two days after dosing, on day
17. Both the ZOL and DOX + ZOL groups showed decreased TRACP 5b on day 24 compared to the control
group [Figure 5B]. The number of osteoclasts was 25%-50% lower at the tumor-bone interface in the ZOL
and DOX + ZOL treated groups compared to the vehicle group [Figure 5C], but the differences were not
2+
statistically significant (P = 0.595 and 0.142, respectively). Both groups also had lower blood Ca compared
2+
2+
to the control group (5d). The blood Ca in ZOL and DOX + ZOL groups was similar to the baseline Ca
measured from five healthy animals of same age, sex and strain (1.268 mmol/L, SD 0.0205), whereas the
2+
control group had higher blood Ca compared to the healthy animals (P = 0.038). In the DOX group 4/8
animals were above the range of healthy mice (> 1.29 mmol/L), but the group average did not differ from the
control group.