
Page 15 - Read Online
P. 15
Komiya et al. J Cancer Metastasis Treat 2018;4:1 I http://dx.doi.org/10.20517/2394-4722.2017.65 Page 5 of 9
Table 2. Univariate and Multivariate analyses for prognostic factors on PFS and OS in NSCLC patients treated with
nivolumab
Factor PFS OS
Univariate analysis Multivariate analysis Univariate analysis Multivariate analysis
HR (95%CI) HR (95%CI) HR (95%CI) HR (95%CI)
P value P value P value P value
Age ( < 70 vs. ≥ 70) 0.882 (0.698-1.136) 0.938 (0.729-1.228) 0.858 (0.659-1.146) 0.952 (0.710-1.277)
0.31909 0.633 0.288 0.744
Stage at diagnosis (III vs. IV) 0.829 (0.652-1.038) 0.849 (0.651-1.099) 0.988 (0.766-1.258) 0.959 (0.724-1.271)
0.104 0.216 0.923 0.772
Histology 0.939 (0.762-1.163) 0.841 (0.659-1.077) 0.788 (0.621-0.100) 0.727 (0.549-0.964)
(nonsquamous vs. squamous) 0.561 0.168 0.050 0.027
Sex (female vs. male) 0.810 (0.650-1.002) 0.826 (0.660-1.026) 0.829 (0.645-1.054) 0.817 (0.636-1.048)
0.052 0.084 0.127 0.107
Performance Status vs. 2+) 0.902 (0.710-1.172) 0.877 (0.680-1.155) 0.767 (0.591-1.019) 0.716 (0.538-0.952)
0.425 0.340 0.066 0.028
No. of systemic treatment 0.848 (0.668-1.100) 0.967 (0.733-1.303) 0.893 (0.679-1.212) 0.983 (0.705-1.371)
(0-1 vs. 2+) 0.205 0.820 0.451 0.919
Previous anti-angiogenesis 1.466 (1.087-1.913) 1.444 (1.009-2.029) 1.277 (0.867-1.771) 1.506 (0.979-2.316)
(yes vs. no) 0.014 0.044 0.200 0.074
Table 3. Best objective response according to prior anti-angiogenesis treatment
Total n (%) Prior anti-angiogenesis agent P value
Yes No
134 (100) 16 (100) 118 (100)
ORR (CR + PR) 11 (8) 1 (6) 10 (8) 1.00
Non-ORR 123 (92) 15 (94) 108 (92)
SD 43 (32) 2 (13) 41 (35)
PD 40 (30) 7 (44) 33 (28)
NE 40 (30) 6 (38) 34 (29)
DCR (CR + PR + SD) 54 (40) 3 (19) 51 (43) 0.101
Others (PD + NE) 80 (60) 13 (81) 67 (57)
ORR: overall response rate; CR: complete response; PR: partial response; SD: stable disease; NE: not evaluable; DCR: disease control rate
Age Sex Stage at diagnosis
Progression-free probability Log Rank P value: 0.2097 Log Rank P value: 0.0731 Log Rank P value: 0.3130
< 70
Female
III
70 ≤
IV
Male
Weeks Weeks Weeks
Histology PS No. of systemic treatment lines
Progression-free probability Log Rank P value: 0.2749 Log Rank P value: 0.5048 Log Rank P value: 0.3114
0-1
0-1
Nonsq
2+
2+
Sq
Weeks Weeks Weeks
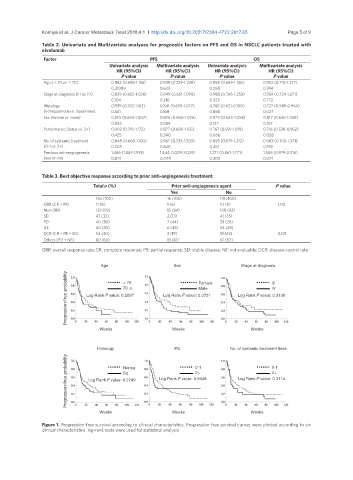
Figure 1. Progression-free survival according to clinical characteristics. Progression-free survival curves were plotted according to six
clinical characteristics. log-rank tests were used for statistical analysis