
Page 19 - Read Online
P. 19
Dankbaar et al. J Cancer Metastasis Treat 2021;7:56 https://dx.doi.org/10.20517/2394-4722.2021.112 Page 3 of 8
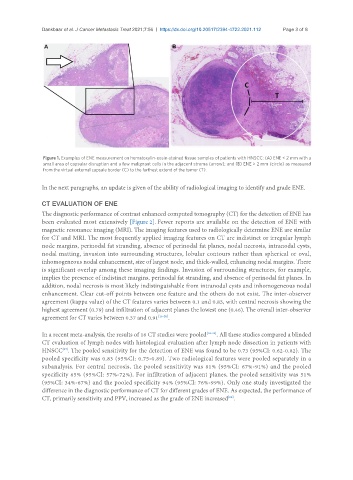
Figure 1. Examples of ENE measurement on hematoxylin-eosin-stained tissue samples of patients with HNSCC: (A) ENE < 2 mm with a
small area of capsular disruption and a few malignant cells in the adjacent stroma (arrow); and (B) ENE > 2 mm (circle) as measured
from the virtual external capsule border (C) to the farthest extend of the tumor (T).
In the next paragraphs, an update is given of the ability of radiological imaging to identify and grade ENE.
CT EVALUATION OF ENE
The diagnostic performance of contrast enhanced computed tomography (CT) for the detection of ENE has
been evaluated most extensively [Figure 2]. Fewer reports are available on the detection of ENE with
magnetic resonance imaging (MRI). The imaging features used to radiologically determine ENE are similar
for CT and MRI. The most frequently applied imaging features on CT are indistinct or irregular lymph
node margins, perinodal fat stranding, absence of perinodal fat planes, nodal necrosis, intranodal cysts,
nodal matting, invasion into surrounding structures, lobular contours rather than spherical or oval,
inhomogeneous nodal enhancement, size of largest node, and thick-walled, enhancing nodal margins. There
is significant overlap among these imaging findings. Invasion of surrounding structures, for example,
implies the presence of indistinct margins, perinodal fat stranding, and absence of perinodal fat planes. In
addition, nodal necrosis is most likely indistinguishable from intranodal cysts and inhomogeneous nodal
enhancement. Clear cut-off points between one feature and the others do not exist. The inter-observer
agreement (kappa value) of the CT features varies between 0.1 and 0.83, with central necrosis showing the
highest agreement (0.79) and infiltration of adjacent planes the lowest one (0.46). The overall inter-observer
agreement for CT varies between 0.37 and 0.91 [16-20] .
In a recent meta-analysis, the results of 16 CT studies were pooled [16-32] . All these studies compared a blinded
CT evaluation of lymph nodes with histological evaluation after lymph node dissection in patients with
HNSCC . The pooled sensitivity for the detection of ENE was found to be 0.73 (95%CI: 0.62-0.82). The
[27]
pooled specificity was 0.83 (95%CI: 0.75-0.89). Two radiological features were pooled separately in a
subanalysis. For central necrosis, the pooled sensitivity was 81% (95%CI: 67%-91%) and the pooled
specificity 65% (95%CI: 57%-72%). For infiltration of adjacent planes, the pooled sensitivity was 51%
(95%CI: 34%-67%) and the pooled specificity 94% (95%CI: 76%-99%). Only one study investigated the
difference in the diagnostic performance of CT for different grades of ENE. As expected, the performance of
[28]
CT, primarily sensitivity and PPV, increased as the grade of ENE increased .