
Page 73 - Read Online
P. 73
Page 8 of 19 Serzan et al. J Cancer Metastasis Treat 2021;7:39 https://dx.doi.org/10.20517/2394-4722.2021.76
mg IV q2wk vs. Sun (50 mg qd)a
[29] b
CLEAR ITT 71% (16) P < 0.001 23.9 0.39 (0.32- NR 0.66 (0.49-
- R, open label ph 3; treatment naïve patients Lenv/Pembro ( 0.49) 0.88)
(N = 1069) N = 454) P < 0.001 P = 0.005
- Primary Endpoint: PFS (by IRC) in ITT Lenv/Evero (N 53% (10) P < 0.001 14.7 1.15 (0.88-
- Lenv/Pembro (Lenv 18 mg PO qd + Pembro = 461) 0.65 (0.53- NR b 1.5)
200 mg IV q3wk vs. Lenv 14mg PO qd + Evero 0.80) P = 0.30
5mg Po qd vs. Sun (50mg qd)a
P < 0.001
b
Sun (N = 461) 36% (4) 9.2 NR
a 4 wk on/2 wk off.
Atezo: Atezolizumab; Avel: avelumab; Axi: axitinib; Bev: bevacizumab; Cabo: cabozantinib; CI: confidence interval; Evero: everolimus; HR: hazard
ratio; IMDC: International Metastatic Renal Cell Carcinoma; int: intermediate; inv: investigator; Ipi: ipilimumab; IRC: independent review
committee; ITT: intention to treat; Lenv: lenvatinib; mo: month(s); NA: not applicable; Nivo: nivolumab; NR: not reached; ORR: objective response
rate; OS: overall survival; PD-L1: programmed cell death ligand 1; PFS: progression free survival; Ph: phase; q3wk: every 3 weeks; qd: once daily; r:
randomized; Sun: sunitinib; wk: week.
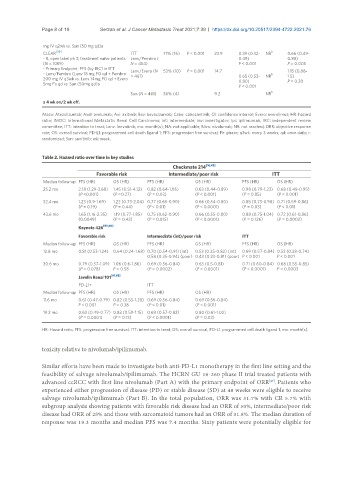
Table 2. Hazard ratio over time in key studies
Checkmate 214 [16,43]
Favorable risk Intermediate/poor risk ITT
Median follow-up PFS (HR) OS (HR) PFS (HR) OS (HR) PFS (HR) OS (HR)
25.2 mo 2.18 (1.29-3.68) 1.45 (0.51-4.12) 0.82 (0.64-1.05) 0.63 (0.44-0.89) 0.98 (0.79-1.23) 0.68 (0.49-0.95)
(P <0.001) (P =0.27) (P = 0.03) (P < 0.001) (P = 0.85) (P < 0.001)
32.4 mo 1.23 (0.9-1.69) 1.22 (0.73-2.04) 0.77 (0.65-0.90) 0.66 (0.54-0.80) 0.85 (0.73-0.98) 0.71 (0.59-0.86)
(P = 0.19) (P = 0.44) (P < 0.01) (P < 0.0001) (P = 0.03) (P < 0.01)
43.6 mo 1.65 (1.16-2.35) 1.19 (0.77-1.85) 0.75 (0.62-0.90) 0.66 (0.55-0.80) 0.88 (0.75-1.04) 0.72 (0.61-0.86)
(0.0049) (P = 0.43) (P = 0.015) (P < 0.0001) (P = 0.126) (P = 0.0002)
Keynote 426 [59,60]
Favorable risk Intermediate (int)/poor risk ITT
Median follow-up PFS (HR) OS (HR) PFS (HR) OS (HR) PFS (HR) OS (HR)
12.8 mo 0.81 (0.53-1.24) 0.64 (0.24-1.68) 0.70 (0.54-0.91) (int) 0.53 (0.35-0.82) (int) 0.69 (0.57-0.84) 0.53 (0.38-0.74)
0.58 (0.35-0.94) (poor) 0.43 (0.23-0.81) (poor) P < 0.001 P < 0.001
30.6 mo 0.79 (0.57-1.09) 1.06 (0.6-1.86) 0.69 (0.56-0.84) 0.63 (0.5-0.81) 0.71 (0.60-0.84) 0.68 (0.55-0.85)
(P = 0.078) P = 0.58 (P = 0.0002) (P = 0.0001) (P < 0.0001) P = 0.0003
Javelin Renal 101 [61,62]
PD-L1+ ITT
Median follow-up PFS (HR) OS (HR) PFS (HR) OS (HR)
11.6 mo 0.61 (0.47-0.79) 0.82 (0.53-1.28) 0.69 (0.56-0.84) 0.69 (0.56-0.84)
P < 0.001 P = 0.38 (P < 0.01) (P < 0.001)
19.2 mo 0.62 (0.49-0.77) 0.83 (0.59-1.15) 0.69 (0.57-0.82) 0.80 (0.61-1.02)
(P = 0.0001) (P = 0.13) (P < 0.0001) (P = 0.03)
HR: Hazard ratio; PFS: progression free survival; ITT: intention to treat; OS: overall survival; PD-L1: programmed cell death ligand 1; mo: month(s).
toxicity relative to nivolumab/ipilimumab.
Similar efforts have been made to investigate both anti-PD-L1 monotherapy in the first line setting and the
feasibility of salvage nivolumab/ipilimumab. The HCRN GU 16-260 phase II trial treated patients with
[47]
advanced ccRCC with first line nivolumab (Part A) with the primary endpoint of ORR . Patients who
experienced either progression of disease (PD) or stable disease (SD) at 48 weeks were eligible to receive
salvage nivolumab/ipilimumab (Part B). In the total population, ORR was 31.7% with CR 5.7% with
subgroup analysis showing patients with favorable risk disease had an ORR of 50%, intermediate/poor risk
disease had ORR of 25% and those with sarcomatoid tumors had an ORR of 31.8%. The median duration of
response was 19.3 months and median PFS was 7.4 months. Sixty patients were potentially eligible for