
Page 90 - Read Online
P. 90
Page 6 of 12 Goyal et al. J Cancer Metastasis Treat 2021;7:18 https://dx.doi.org/10.20517/2394-4722.2020.143
Table 1. IC values of P450 2A6 inhibition by compounds 1 to 7
50
Compound IC50 (µM)
1 9.034
2 193.8
3 0
4 5.024
5 66.91
6 1.003
7 42.51
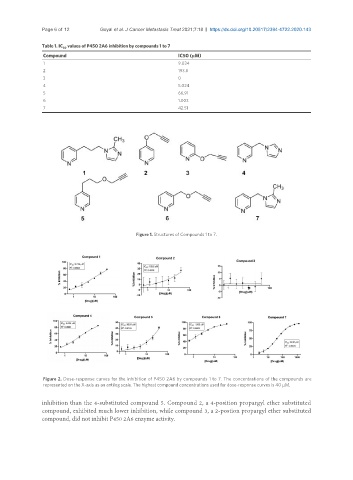
Figure 1. Structures of Compounds 1 to 7.
Figure 2. Dose-response curves for the inhibition of P450 2A6 by compounds 1 to 7. The concentrations of the compounds are
represented on the X-axis as an antilog scale. The highest compound concentrations used for dose-response curves is 40 µM.
inhibition than the 4-substituted compound 5. Compound 2, a 4-position propargyl ether substituted
compound, exhibited much lower inhibition, while compound 3, a 2-postion propargyl ether substituted
compound, did not inhibit P450 2A6 enzyme activity.