
Page 69 - Read Online
P. 69
Page 4 of 12 Conti et al. J Cancer Metastasis Treat 2019;5:64 I http://dx.doi.org/10.20517/2394-4722.2019.015
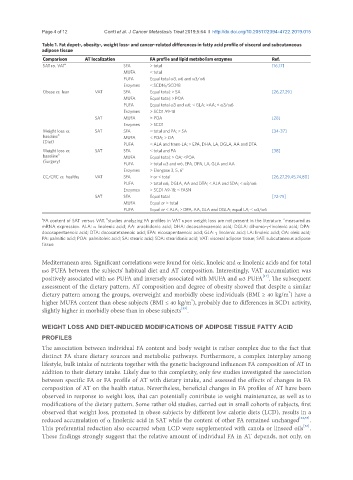
Table 1. Fat depot-, obesity-, weight loss- and cancer-related differences in fatty acid profile of visceral and subcutaneous
adipose tissue
Comparison AT localization FA profile and lipid metabolism enzymes Ref.
SAT vs. VAT a SFA > total [16,17]
MUFA ˂ total
PUFA Equal total ω3, ω6 and ω3/ω6
Enzymes ˂ SCD16/SCD18
Obese vs. lean VAT SFA Equal total; > SA [26,27,29]
MUFA Equal total; > POA
PUFA Equal total ω3 and ω6; ˂ GLA; >AA; < ω3/ω6
Enzymes > SCD1 Δ9-18
SAT MUFA > POA [28]
Enzymes > SCD1
Weight loss vs. SAT SFA ˂ total and PA; > SA [34-37]
baseline b MUFA ˂ POA; > OA
(Diet)
PUFA ˂ ALA and trans-LA; > EPA, DHA, LA, DGLA, AA and DTA
Weight loss vs. SAT SFA ˂ total and PA [38]
baseline b MUFA Equal total; > OA; <POA
(Surgery)
PUFA > total ω3 and ω6, EPA, DPA, LA, GLA and AA
Enzymes > Elongase 3, 5, 6 c
CC/CRC vs. healthy VAT SFA > or < total [26,27,29,45,74,80]
PUFA > total ω6, DGLA, AA and DTA; ˂ ALA and SDA; < ω3/ω6
Enzymes > SCD1 Δ9-18; ˂ FASN
SAT SFA Equal total [72-75]
MUFA Equal or > total
PUFA Equal or < ALA; > DPA, AA, GLA and DGLA; equal LA; ˂ ω3/ω6
c
a FA content of SAT versus VAT. studies analyzing FA profiles in VAT upon weight loss are not present in the literature. measured as
b
mRNA expression. ALA: α linolenic acid; AA: arachidonic acid; DHA: decosahexaenoic acid; DGLA: dihomo-γ-linolenic acid; DPA:
docosapentaenoic acid; DTA: docosatetraenoic acid; EPA: eicosapentaenoic acid; GLA: γ linolenic acid; LA: linoleic acid; OA: oleic acid;
PA: palmitic acid; POA: palmitoleic acid; SA: stearic acid; SDA: stearidonic acid; VAT: visceral adipose tissue; SAT: subcutaneous adipose
tissue
Mediterranean area. Significant correlations were found for oleic, linoleic and α linolenic acids and for total
ω6 PUFA between the subjects’ habitual diet and AT composition. Interestingly, VAT accumulation was
[17]
positively associated with ω6 PUFA and inversely associated with MUFA and ω3 PUFA . The subsequent
assessment of the dietary pattern, AT composition and degree of obesity showed that despite a similar
2
dietary pattern among the groups, overweight and morbidly obese individuals (BMI ≥ 40 kg/m ) have a
higher MUFA content than obese subjects (BMI ≤ 40 kg/m ), probably due to differences in SCD1 activity,
2
[33]
slightly higher in morbidly obese than in obese subjects .
WEIGHT LOSS AND DIET-INDUCED MODIFICATIONS OF ADIPOSE TISSUE FATTY ACID
PROFILES
The association between individual FA content and body weight is rather complex due to the fact that
distinct FA share dietary sources and metabolic pathways. Furthermore, a complex interplay among
lifestyle, bulk intake of nutrients together with the genetic background influences FA composition of AT in
addition to their dietary intake. Likely due to this complexity, only few studies investigated the association
between specific FA or FA profile of AT with dietary intake, and assessed the effects of changes in FA
composition of AT on the health status. Nevertheless, beneficial changes in FA profiles of AT have been
observed in response to weight loss, that can potentially contribute to weight maintenance, as well as to
modifications of the dietary pattern. Some rather old studies, carried out in small cohorts of subjects, first
observed that weight loss, promoted in obese subjects by different low calorie diets (LCD), results in a
reduced accumulation of α linolenic acid in SAT while the content of other FA remained unchanged [34,35] .
[36]
This preferential reduction also occurred when LCD were supplemented with canola or linseed oils .
These findings strongly suggest that the relative amount of individual FA in AT depends, not only, on