
Page 28 - Read Online
P. 28
Ossoliński et al. J Cancer Metastasis Treat 2019;5:1 I http://dx.doi.org/10.20517/2394-4722.2018.63 Page 7 of 12
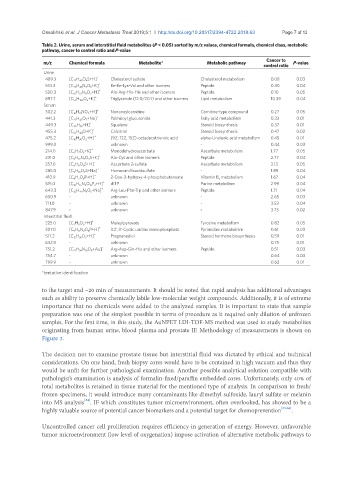
Table 2. Urine, serum and interstitial fluid metabolites (P < 0.05) sorted by m/z values, chemical formula, chemical class, metabolic
pathway, cancer to control ratio and P-value
Cancer to
m/z Chemical formula Metabolite* Metabolic pathway P-value
control ratio
Urine
489.3 [C 27 H 46 O 4 S+H] + Cholesterol sulfate Cholesterol metabolism 0.08 0.03
510.3 [C 23 H 45 N 5 O 5 +K] + Ile-Ile-Lys-Val and other isomers Peptide 0.30 0.04
520.3 [C 21 H 33 N 11 O 5 +H] + Ala-Arg-His-His and other isomers Peptide 0.10 0.05
897.7 [C 55 H 102 O 6 +K] + Triglyceride (12:0/20:1) and other isomers Lipid metabolism 10.39 0.04
Serum
302.2 [C 16 H 31 NO 4 +H] + Nonanoylcarnitine Carnitine-type compound 0.27 0.05
441.3 [C 22 H 42 O 7 +Na] + Palmitoyl glucuronide Fatty acid metabolism 0.33 0.01
449.3 [C 30 H 50 +H] + Squalene Steroid biosynthesis 0.37 0.01
455.3 [C 27 H 44 O+K] + Calcitriol Steroid biosynthesis 0.47 0.02
475.2 [C 18 H 30 O 2 +H] + (9Z, 12Z, 15Z)-octadecatrienoic acid alpha-Linolenic acid metabolism 0.45 0.01
999.3 - unknown - 0.44 0.03
214.0 [C 6 H 7 O 6 +K] + Monodehydroascorbate Ascorbate metabolism 1.77 0.05
231.0 [C 6 H 12 N 2 O 3 S+K] + Ala-Cys and other isomers Peptide 2.77 0.04
257.0 [C 6 H 8 O 9 S+H] + Ascorbate 2-sulfate Ascorbate metabolism 2.13 0.05
285.0 [C 9 H 10 O 7 S+Na] + Homovanillicacidsulfate - 1.89 0.04
410.9 [C 4 H 7 O 8 P+H] + 2-Oxo-3-hydroxy-4-phosphobutanoate Vitamin B 6 metabolism 1.67 0.04
515.0 [C 10 H 15 N 4 O 13 P 3 +H] + dITP Purine metabolism 2.99 0.04
643.3 [C 32 H 44 N 8 O 5 +Na] + Arg-Leu-Phe-Trp and other isomers Peptide 1.71 0.04
650.9 - unknown - 2.65 0.03
711.0 - unknown - 3.53 0.04
847.9 - unknown - 3.73 0.02
Interstitial fluid
225.0 [C 7 H 6 O 6 +H] + Maleylpyruvate Tyrosine metabolism 0.82 0.05
307.0 [C 9 H 11 N 2 O 8 P+H] + 3.2’,3’-Cyclic uridine monophosphate Pyrimidine metabolism 0.61 0.03
517.2 [C 21 H 36 O 2 +H] + Pregnanediol Steroid hormone biosynthesis 0.59 0.01
632.9 - unknown 0.75 0.01
751.2 [C 21 H 34 N 10 O 8 +Au] + Arg-Asp-Gln-His and other isomers Peptide 0.51 0.03
754.7 - unknown 0.64 0.03
799.9 - unknown 0.63 0.01
*tentative identification
to the target and ~20 min of measurements. It should be noted that rapid analysis has additional advantages
such as ability to preserve chemically labile low-molecular weight compounds. Additionally, it is of extreme
importance that no chemicals were added to the analyzed samples. It is important to state that sample
preparation was one of the simplest possible in terms of procedure as it required only dilution of unfrozen
samples. For the first time, in this study, the AuNPET LDI-TOF-MS method was used to study metabolites
originating from human urine, blood plasma and prostate IF. Methodology of measurements is shown on
Figure 3.
The decision not to examine prostate tissue but interstitial fluid was dictated by ethical and technical
considerations. On one hand, fresh biopsy cores would have to be contained in high vacuum and thus they
would be unfit for further pathological examination. Another possible analytical solution compatible with
pathologist’s examination is analysis of formalin-fixed/paraffin embedded cores. Unfortunately, only 40% of
total metabolites is retained in tissue material for the mentioned type of analysis. In comparison to fresh/
frozen specimens, it would introduce many contaminants like dimethyl sulfoxide, lauryl sulfate or melanin
[24]
into MS analysis . IF which constitutes tumor microenvironment, often overlooked, has showed to be a
highly valuable source of potential cancer biomarkers and a potential target for chemoprevention [25,26] .
Uncontrolled cancer cell proliferation requires efficiency in generation of energy. However, unfavorable
tumor microenvironment (low level of oxygenation) impose activation of alternative metabolic pathways to