Page 27 - Read Online
P. 27

Page 6 of 12                     Ossoliński et al. J Cancer Metastasis Treat 2019;5:1  I  http://dx.doi.org/10.20517/2394-4722.2018.63


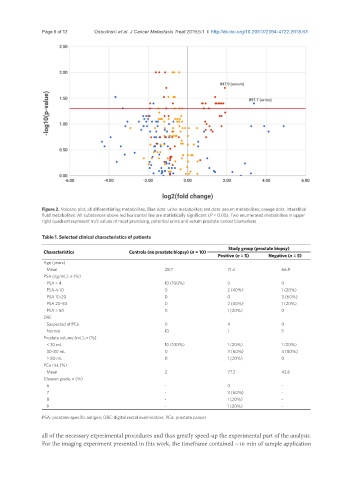
               Figure 2. Volcano plot, all differentiating metabolites. Blue dots: urine metabolites; red dots: serum metabolites; orange dots: interstitial
               fluid metabolites. All substances above red horizontal line are statistically significant (P < 0.05). Two enumerated metabolites in upper
               right quadrant represent m/z values of most promising, potential urine and serum prostate cancer biomarkers

               Table 1. Selected clinical characteristics of patients

                                                                              Study group (prostate biopsy)
                Characteristics              Controls (no prostate biopsy) (n = 10)
                                                                           Positive (n = 5)  Negative (n = 5)
                Age (years)
                   Mean                                  28.7                 71.4              66.8
                PSA (ng/mL), n (%)
                   PSA < 4                               10 (100%)            0                 0
                   PSA 4-10                              0                    2 (40%)           1 (20%)
                   PSA 10-20                             0                    0                 3 (60%)
                   PSA 20-50                             0                    2 (40%)           1 (20%)
                   PSA > 50                              0                    1 (20%)           0
                DRE
                   Suspected of PCa                      0                    4                 0
                   Normal                                10                   1                 5
                Prostate volume (mL), n (%)
                   < 30 mL                               10 (100%)            1 (20%)           1 (20%)
                   30-80 mL                              0                    3 (60%)           4 (80%)
                   > 80 mL                               0                    1 (20%)           0
                PCa risk (%)
                   Mean                                  2                    77.2              42.6
                Gleason grade, n (%)
                   6                                     -                    0                 -
                   7                                     -                    3 (60%)           -
                   8                                     -                    1 (20%)           -
                   9                                     -                    1 (20%)           -
               PSA: prostate-specific antigen; DRE: digital rectal examination; PCa: prostate cancer

               all of the necessary experimental procedures and thus greatly speed-up the experimental part of the analysis.
               For the imaging experiment presented in this work, the timeframe contained ~10 min of sample application
   22   23   24   25   26   27   28   29   30   31   32