
Page 25 - Read Online
P. 25
Page 4 of 12 Ossoliński et al. J Cancer Metastasis Treat 2019;5:1 I http://dx.doi.org/10.20517/2394-4722.2018.63
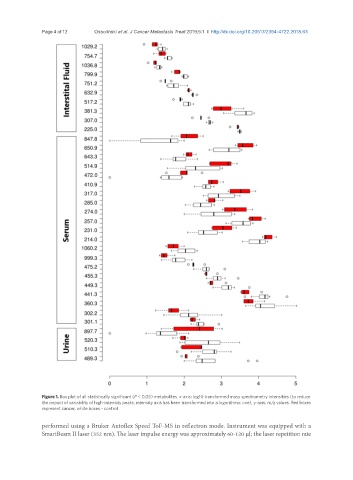
Figure 1. Box plot of all statistically significant (P < 0.05) metabolites. x-axis: log10 transformed mass spectrometry intensities (to reduce
the impact of variability of high-intensity peaks, intensity axis has been transformed into a logarithmic one); y-axis: m/z values. Red boxes
represent cancer, white boxes - control
performed using a Bruker Autoflex Speed ToF-MS in reflectron mode. Instrument was equipped with a
SmartBeam II laser (352 nm). The laser impulse energy was approximately 60-120 µJ; the laser repetition rate