
Page 13 - Read Online
P. 13
Zaichick et al. J Cancer Metastasis Treat 2018;4:60 I http://dx.doi.org/10.20517/2394-4722.2018.52 Page 7 of 15
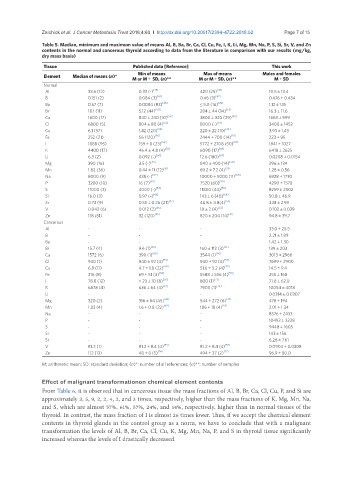
Table 5. Median, minimum and maximum value of means Al, B, Ba, Br, Ca, Cl, Cu, Fe, I, K, Li, Mg, Mn, Na, P, S, Si, Sr, V, and Zn
contents in the normal and cancerous thyroid according to data from the literature in comparison with our results (mg/kg,
dry mass basis)
Tissue Published data [Reference] This work
Element Median of means (n)* Min of means Max of means Males and females
M or M ± SD, (n)** M or M ± SD, (n)** M ± SD
Normal
Al 33.6 (12) 0.33 (-) [45] 420 (25) [46] 10.5 ± 13.4
B 0.151 (2) 0.084 (3) [47] 0.46 (3) [47] 0.476 ± 0.434
Ba 0.67 (7) 0.0084 (83) [48] ≤ 5.0 (16) [49] 1.12 ± 1.15
Br 18.1 (11) 5.12 (44) [50] 284 ± 44 (14) [51] 16.3 ± 11.6
Ca 1600 (17) 840 ± 240 (10) [52] 3800 ± 320 (29) [52] 1663 ± 999
Cl 6800 (5) 804 ± 80 (4) [53] 8000 (-) [54] 3400 ± 1452
Cu 6.1 (57) 1.42 (120) [55] 220 ± 22 (10) [53] 3.93 ± 1.43
Fe 252 (21) 56 (120) [55] 2444 ± 700 (14) [51] 223 ± 95
I 1888 (95) 159 ± 8 (23) [56] 5772 ± 2708 (50) [57] 1841 ± 1027
K 4400 (17) 46.4 ± 4.8 (4) [53] 6090 (17) [49] 6418 ± 2625
Li 6.3 (2) 0.092 (-) [58] 12.6 (180) [59] 0.0208 ± 0.0154
Mg 390 (16) 3.5 (-) [45] 840 ± 400 (14) [60] 296 ± 134
Mn 1.82 (36) 0.44 ± 11 (12) [61] 69.2 ± 7.2 (4) [53] 1.28 ± 0.56
Na 8000 (9) 438 (-) [62] 10000 ± 5000 (11) [60] 6928 ± 1730
P 3200 (10) 16 (7) [63] 7520 (60) [50] 4290 ± 1578
S 11000 (3) 4000 (-) [54] 11800 (44) [50] 8259 ± 2002
Si 16.0 (3) 0.97 (-) [45] 143 ± 6 (40) [64] 50.8 ± 46.9
Sr 0.73 (9) 0.55 ± 0.26 (21) [47] 46.8 ± 4.8(4) [53] 3.81 ± 2.93
V 0.042 (6) 0.012 (2) [65] 18 ± 2 (4) [53] 0.102 ± 0.039
Zn 118 (51) 32 (120) [55] 820 ± 204 (14) [51] 94.8 ± 39.7
Cancerous
Al - - - 33.0 ± 25.5
B - - - 2.21 ± 1.89
Ba - - - 1.42 ± 1.30
Br 15.7 (4) 9.6 (1) [66] 160 ± 112 (3) [67] 139 ± 203
Ca 1572 (6) 390 (1) [68] 3544 (1) [66] 3013 ± 2966
Cl 940 (1) 940 ± 92 (4) [53] 940 ± 92 (4) [53] 7699 ± 2900
Cu 6.8 (11) 4.7 ± 1.8 (22) [69] 51.6 ± 5.2 (4) [53] 14.5 ± 9.4
Fe 316 (8) 69 ± 51 (3) [68] 5588 ± 556 (4) [53] 255 ± 168
I 78.8 (12) < 23 ± 10 (8) [70] 800 (1) [71] 71.8 ± 62.0
K 6878 (4) 636 ± 64 (4) [54] 7900 (1) [72] 10054 ± 4018
Li - - - 0.0314 ± 0.0307
Mg 320 (2) 316 ± 84 (45) [69] 544 ± 272 (6) [73] 478 ± 194
Mn 1.83 (4) 1.6 ± 0.8 (22) [69] 186 ± 18 (4) [53] 2.01 ± 1.34
Na - - - 8576 ± 2433
P - - - 10493 ± 3238
S - - - 9448 ± 1605
Si - - - 143 ± 156
Sr - - - 6.26 ± 7.61
V 81.2 (1) 81.2 ± 8.4 (4) [53] 81.2 ± 8.4 (4) [53] 0.0904 ± 0.0308
Zn 112 (13) 48 ± 8 (5) [74] 494 ± 37 (2) [72] 96.9 ± 80.0
M; arithmetic mean; SD: standard deviation; (n)*: number of all references; (n)**: number of samples
Effect of malignant transformationon chemical element contents
From Table 6, it is observed that in cancerous tissue the mass fractions of Al, B, Br, Ca, Cl, Cu, P, and Si are
approximately 3, 5, 9, 2, 2, 4, 2, and 3 times, respectively, higher than the mass fractions of K, Mg, Mn, Na,
and S, which are almost 57%, 61%, 57%, 24%, and 14%, respectively, higher than in normal tissues of the
thyroid. In contrast, the mass fraction of I is almost 26 times lower. Thus, if we accept the chemical element
contents in thyroid glands in the control group as a norm, we have to conclude that with a malignant
transformation the levels of Al, B, Br, Ca, Cl, Cu, K, Mg, Mn, Na, P, and S in thyroid tissue significantly
increased whereas the levels of I drastically decreased.