
Page 10 - Read Online
P. 10
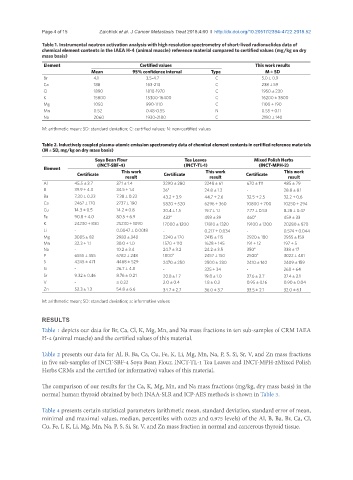
Page 4 of 15                         Zaichick et al. J Cancer Metastasis Treat 2018;4:60  I  http://dx.doi.org/10.20517/2394-4722.2018.52

               Table 1. Instrumental neutron activation analysis with high resolution spectrometry of short-lived radionuclides data of
               chemical element contents in the IAEA H-4 (animal muscle) reference material compared to certified values (mg/kg on dry
               mass basis)
                Element                         Certified values                       This work results
                                Mean          95% confidence interval   Type              M ± SD
                Br               4.1              3.5-4.7                 C              5.0 ± 0.9
                Ca               188              163-213                 C              238 ± 59
                Cl               1890             1810-1970               C              1950 ± 230
                K                15800            15300-16400             C              16200 ± 3800
                Mg               1050             990-1110                C              1100 ± 190
                Mn               0.52             0.48-0.55               N              0.55 ± 0.11
                Na               2060             1930-2180               C              2190 ± 140
               M: arithmetic mean; SD: standard deviation; C: certified values; N: non-certified values


               Table 2. Inductively coupled plasma-atomic emission spectrometry data of chemical element contents in certified reference materials
               (M ± SD, mg/kg on dry mass basis)
                                 Soya Bean Flour               Tea Leaves              Mixed Polish Herbs
                                  (INCT-SBF-4)                 (INCT-TL-1)              (INCT-MPH-2)
                Element
                           Certificate    This work     Certificate   This work     Certificate  This work
                                           result                       result                    result
                Al        45.5 ± 3.7    37.1 ± 1.4      2290 ± 280    2248 ± 61     670 ± 111    485 ± 79
                B         39.9 ± 4.0    34.5 ± 1.4      26 a          24.8 ± 1.2    -            28.8 ± 8.1
                Ba        7.30 ± 0.23   7.38 ± 0.23     43.2 ± 3.9    44.7 ± 2.6    32.5 ± 2.5   32.2 ± 0.6
                Ca        2467 ± 170    2737 ± 190      5820 ± 520    6296 ± 360    10800 ± 700  10250 ± 294
                Cu        14.3 ± 0.5    14.2 ± 0.8      20.4 ± 1.5    19.7 ± 1.1    7.77 ± 0.53  8.28 ± 0.47
                Fe        90.8 ± 4.0    80.5 ± 6.9      432 a         493 ± 39      460 a        459 ± 33
                K         24230 ± 830   25230 ± 1090    17000 ± 1200  17810 ± 1320  19100 ± 1200  20280 ± 870
                Li        -             0.0047 ± 0.0018  -            0.217 ± 0.034  -           0.574 ± 0.044
                Mg        3005 ± 82     2983 ± 340      2240 ± 170    2415 ± 115    2920 ± 180   2955 ± 159
                Mn        32.3 ± 1.1    30.0 ± 1.0      1570 ± 110    1628 ± 145    191 ± 12     197 ± 5
                Na        -             10.2 ± 3.4      24.7 ± 3.2    24.2 ± 3.5    350 a        338 ± 17
                P         6555 ± 355    6782 ± 248      1800 a        2457 ± 150    2500 a       3022 ± 481
                S         4245 ± 471    4468 ± 529      2470 ± 250    2500 ± 230    2410 ± 140   2409 ± 159
                Si        -             26.7 ± 4.8      -             325 ± 34      -            268 ± 64
                Sr        9.32 ± 0.46   8.76 ± 0.21     20.8 ± 1.7    19.8 ± 1.0    37.6 ± 2.7   37.4 ± 2.1
                V         -             ≤ 0.22          2.0 ± 0.4     1.8 ± 0.2     0.95 ± 0.16  0.90 ± 0.04
                Zn        52.3 ± 1.3    54.8 ± 6.6      34.7 ± 2.7    36.0 ± 3.7    33.5 ± 2.1   32.0 ± 6.1

               M: arithmetic mean; SD: standard deviation; a: informative values

               RESULTS
               Table 1 depicts our data for Br, Ca, Cl, K, Mg, Mn, and Na mass fractions in ten sub-samples of CRM IAEA
               H-4 (animal muscle) and the certified values of this material.

               Table 2 presents our data for Al, B, Ba, Ca, Cu, Fe, K, Li, Mg, Mn, Na, P, S, Si, Sr, V, and Zn mass fractions
               in five sub-samples of INCT-SBF-4 Soya Bean Flour, INCT-TL-1 Tea Leaves and INCT-MPH-2Mixed Polish
               Herbs CRMs and the certified (or informative) values of this material.

               The comparison of our results for the Ca, K, Mg, Mn, and Na mass fractions (mg/kg, dry mass basis) in the
               normal human thyroid obtained by both INAA-SLR and ICP-AES methods is shown in Table 3.

               Table 4 presents certain statistical parameters (arithmetic mean, standard deviation, standard error of mean,
               minimal and maximal values, median, percentiles with 0.025 and 0.975 levels) of the Al, B, Ba, Br, Ca, Cl,
               Cu, Fe, I, K, Li, Mg, Mn, Na, P, S, Si, Sr, V, and Zn mass fraction in normal and cancerous thyroid tissue.