
Page 12 - Read Online
P. 12
Page 6 of 15 Zaichick et al. J Cancer Metastasis Treat 2018;4:60 I http://dx.doi.org/10.20517/2394-4722.2018.52
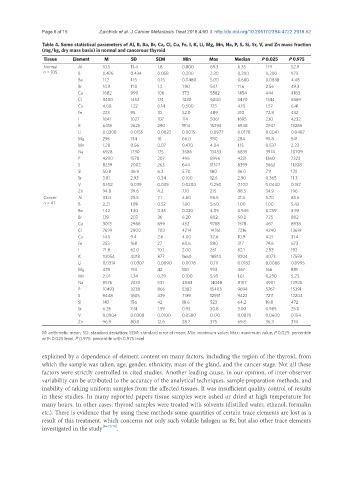
Table 4. Some statistical parameters of Al, B, Ba, Br, Ca, Cl, Cu, Fe, I, K, Li, Mg, Mn, Na, P, S, Si, Sr, V, and Zn mass fraction
(mg/kg, dry mass basis) in normal and cancerous thyroid
Tissue Element M SD SEM Min Max Median P 0.025 P 0.975
Normal Al 10.5 13.4 1.8 0.800 69.3 6.35 1.19 52.9
n = 105 B 0.476 0.434 0.058 0.200 2.30 0.300 0.200 1.73
Ba 1.12 1.15 0.15 0.0480 5.00 0.680 0.0838 4.48
Br 14.9 11.0 1.2 1.90 54.1 11.6 2.56 49.3
Ca 1682 999 106 373 5582 1454 444 4183
Cl 3400 1452 174 1030 6000 3470 1244 5869
Cu 4.08 1.22 0.14 0.500 7.15 4.10 1.57 6.41
Fe 223 95 10 52.0 489 210 72.8 432
I 1841 1027 107 114 5061 1695 230 4232
K 6418 2625 290 1914 15293 5948 2947 13285
Li 0.0208 0.0155 0.0022 0.0015 0.0977 0.0178 0.0041 0.0487
Mg 296 134 16 66.0 930 284 95.8 541
Mn 1.28 0.56 0.07 0.470 4.04 1.15 0.537 2.23
Na 6928 1730 175 3686 13453 6835 3974 10709
P 4290 1578 207 496 8996 4221 1360 7323
S 8259 2002 263 644 11377 8399 3662 11208
Si 50.8 46.9 6.2 5.70 180 36.0 7.11 174
Sr 3.81 2.93 0.34 0.100 12.6 2.90 0.365 11.3
V 0.102 0.039 0.005 0.0200 0.250 0.100 0.0440 0.192
Zn 94.8 39.6 4.2 7.10 215 88.5 34.9 196
Cancer Al 33.0 25.5 7.1 4.50 96.5 21.3 5.70 85.6
n = 41 B 2.21 1.89 0.52 1.00 5.60 1.00 1.00 5.42
Ba 1.42 1.30 0.35 0.220 4.09 0.945 0.259 3.93
Br 139 203 36 6.20 802 50.2 7.75 802
Ca 3013 2966 699 452 9768 1578 467 8938
Cl 7699 2900 703 4214 14761 7216 4240 13619
Cu 14.5 9.4 2.6 4.00 32.6 10.9 4.21 31.4
Fe 255 168 27 60.6 880 217 74.6 673
I 71.8 62.0 10.1 2.00 261 62.1 2.93 192
K 10054 4018 877 1660 18814 9204 4073 17559
Li 0.0314 0.0307 0.0090 0.0078 0.111 0.0182 0.0088 0.0995
Mg 478 194 42 130 933 467 166 881
Mn 2.01 1.34 0.29 0.100 5.95 1.61 0.250 5.23
Na 8576 2433 531 4083 14048 8107 4901 12925
P 10493 3238 866 5382 15403 9694 5767 15391
S 9448 1605 429 7139 12591 9422 7211 12204
Si 143 156 42 18.6 523 64.2 19.8 472
Sr 6.26 7.61 1.59 0.93 30.8 3.00 0.985 25.0
V 0.0904 0.0308 0.0100 0.0580 0.170 0.0870 0.0600 0.154
Zn 96.9 80.0 12.6 28.7 375 69.8 36.3 374
M: arithmetic mean; SD: standard deviation; SEM: standard error of mean; Min: minimum value; Max: maximum value; P 0.025: percentile
with 0.025 level; P 0.975: percentile with 0.975 level
explained by a dependence of element content on many factors, including the region of the thyroid, from
which the sample was taken, age, gender, ethnicity, mass of the gland, and the cancer stage. Not all these
factors were strictly controlled in cited studies. Another leading cause, in our opinion, of inter-observer
variability can be attributed to the accuracy of the analytical techniques, sample preparation methods, and
inability of taking uniform samples from the affected tissues. It was insufficient quality control of results
in these studies. In many reported papers tissue samples were ashed or dried at high temperature for
many hours. In other cases, thyroid samples were treated with solvents (distilled water, ethanol, formalin
etc.). There is evidence that by using these methods some quantities of certain trace elements are lost as a
result of this treatment, which concerns not only such volatile halogen as Br, but also other trace elements
investigated in the study [36,77,78] .