Page 146 - Read Online
P. 146

Page 6 of 12                            Park et al. J Cancer Metastasis Treat 2019;5:17  I  http://dx.doi.org/10.20517/2394-4722.2018.84

               Table 1. Top 40 network objects ranked by occurrence in top 50 pathway maps
                                             Number of maps                                Number of maps
                Ranking     Network objects                    Ranking   Network objects
                                         containing network object                      containing network object
                1               IL-6              24             10      TGF-β receptor type II  8
                2               ICAM-1            20             11      NFKBIA                 7
                3               IL-1 beta         18             11      MHC class II           7
                4               p38 MARK          16             12      WNT5A                  6
                5               VCAM-1            15             12      GRO-2                  6
                6               VEGF-A            12             12      Tcf (Lef)              6
                6               c-Myc             12             12      Bcl-XL                 6
                7               GM-CSF            11             12      WNT                    6
                7               CCL2              11             13      GRO-3                  5
                8               I-kB              10             13      PLAUR                  5
                8               PTCH1             10             13      IL-1α                  5
                8               SHH               10             13      SNAIL1                 5
                9               MMP-1             9              13      PKA-cat                5
                10              Fibronectin       8              13      MMP-13                 5
                10              TCF7L2            8              13      PDGF-R-β               5
                10              Frizzled          8              13      CSF1                   5
                10              TLR2              8              13      PKA-reg                5
                10              GLI-2             8              14      Jagged1                4
                10              Lef-1             8              14      TRF2                   4
               Network object ranking reflects the popularity of each network object in pathway map. Smaller rank value means that network object
               occurs in greater number of maps. ICAM-1: intercellular adhesion molecule-1

               A                                          C


               B


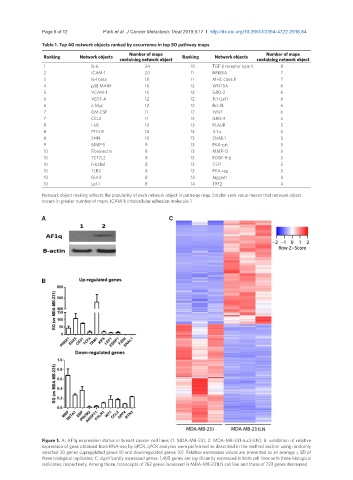
               Figure 1. A: AF1q expression status in breast cancer cell lines (1: MDA-MB-231, 2: MDA-MB-231-luc2-LN); B: validation of relative
               expression of gene obtained from RNA-seq by qPCR. qPCR analyses were performed as described in the method section using randomly
               selected 20 genes (upregulated genes 10 and downregulated genes 10). Relative expression values are presented as an average ± SD of
               three biological replicates; C: significantly expressed genes. 1,485 genes are significantly expressed in both cell lines with three biological
               replicates, respectively. Among those, transcripts of 762 genes increased in MDA-MB-231LN cell line and those of 723 genes decreased
   141   142   143   144   145   146   147   148   149   150   151