Page 39 - Read Online
P. 39

Dumane et al. J Cancer Metastasis Treat 2019;5:42  I  http://dx.doi.org/10.20517/2394-4722.2019.08                         Page 5 of 10

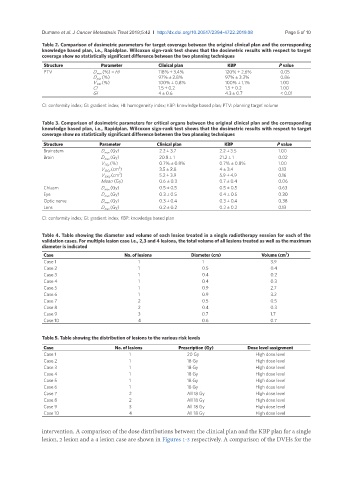
               Table 2. Comparison of dosimetric parameters for target coverage between the original clinical plan and the corresponding
               knowledge based plan, i.e., Rapidplan. Wilcoxon sign-rank test shows that the dosimetric results with respect to target
               coverage show no statistically significant difference between the two planning techniques
                Structure          Parameter          Clinical plan           KBP              P value
                PTV             D max  (%) = HI       118% ± 3.4%            120% ± 2.6%        0.05
                                D min  (%)            97% ± 2.8%             97% ± 3.3%         0.86
                                V 100  (%)            100% ± 0.8%            100% ± 1.1%        1.00
                                CI                    1.5 ± 0.2              1.5 ± 0.2          1.00
                                GI                    4 ± 0.6                4.3 ± 0.7          < 0.01

               CI: conformity index; GI: gradient index; HI: homogeneity index; KBP: knowledge based plan; PTV: planning target volume

               Table 3. Comparison of dosimetric parameters for critical organs between the original clinical plan and the corresponding
               knowledge based plan, i.e., Rapidplan. Wilcoxon sign-rank test shows that the dosimetric results with respect to target
               coverage show no statistically significant difference between the two planning techniques
                Structure          Parameter          Clinical plan          KBP              P value
                Brainstem          D max  (Gy)         2.2 ± 3.7           2.2 ± 3.5           1.00
                Brain              D max  (Gy)         20.8 ± 1            21.2 ± 1            0.02
                                   V 7Gy  (%)          0.7% ± 0.8%         0.7% ± 0.8%         1.00
                                         3
                                   V 12Gy  (cm )       3.5 ± 2.8           4 ± 3.4             0.13
                                         3
                                   V 10Gy  (cm )       5.2 ± 3.9           5.9 ± 4.9           0.16
                                   Mean (Gy)           0.6 ± 0.3           0.7 ± 0.4           0.06
                Chiasm             D max  (Gy)         0.5 ± 0.5           0.5 ± 0.5           0.63
                Eye                D max  (Gy)         0.3 ± 0.5           0.4 ± 0.5           0.30
                Optic nerve        D max  (Gy)         0.3 ± 0.4           0.3 ± 0.4           0.38
                Lens               D max  (Gy)         0.2 ± 0.2           0.2 ± 0.2           0.13
               CI: conformity index; GI: gradient index; KBP: knowledge based plan


               Table 4. Table showing the diameter and volume of each lesion treated in a single radiotherapy session for each of the
               validation cases. For multiple lesion case i.e., 2,3 and 4 lesions, the total volume of all lesions treated as well as the maximum
               diameter is indicated
                                                                                                 3
                Case                       No. of lesions        Diameter (cm)           Volume (cm )
                Case 1                          1                    1                      3.9
                Case 2                          1                    0.5                    0.4
                Case 3                          1                    0.4                    0.2
                Case 4                          1                    0.4                    0.3
                Case 5                          1                    0.9                    2.7
                Case 6                          1                    0.9                    3.2
                Case 7                          2                    0.5                    0.5
                Case 8                          2                    0.4                    0.3
                Case 9                          3                    0.7                    1.7
                Case 10                         4                    0.6                    0.7

               Table 5. Table showing the distribution of lesions to the various risk levels
                Case                    No. of lesions       Prescription (Gy)      Dose level assignment
                Case 1                       1                  20 Gy                  High dose level
                Case 2                       1                  18 Gy                  High dose level
                Case 3                       1                  18 Gy                  High dose level
                Case 4                       1                  18 Gy                  High dose level
                Case 5                       1                  18 Gy                  High dose level
                Case 6                       1                  18 Gy                  High dose level
                Case 7                       2                  All 18 Gy              High dose level
                Case 8                       2                  All 18 Gy              High dose level
                Case 9                       3                  All 18 Gy              High dose level
                Case 10                      4                  All 18 Gy              High dose level


               intervention. A comparison of the dose distributions between the clinical plan and the KBP plan for a single
               lesion, 2 lesion and a 4 lesion case are shown in Figures 1-3 respectively. A comparison of the DVHs for the
   34   35   36   37   38   39   40   41   42   43   44