
Page 76 - Read Online
P. 76
Shi et al. J Cancer Metastasis Treat 2018;4:47 I http://dx.doi.org/10.20517/2394-4722.2018.32 Page 9 of 19
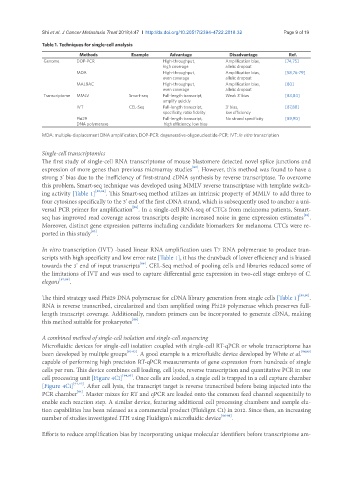
Table 1. Techniques for single-cell analysis
Methods Example Advantage Disadvantage Ref.
Genome DOP-PCR High-throughput, Amplification bias, [74,75]
high coverage allelic dropout
MDA High-throughput, Amplification bias, [58,76-79]
even coverage allelic dropout
MALBAC High-throughput, Amplification bias, [80]
even coverage allelic dropout
Transcriptome MMLV Smart-seq Full-length transcript, Weak 3’ bias [83,84]
amplify quickly
IVT CEL-Seq Full-length transcript, 3’ bias, [87,88]
specificity, ratio fidelity low efficiency
Phi29 Full-length transcript, No strand specificity [89,90]
DNA polymerase high efficiency, low bias
MDA: multiple-displacement DNA amplification; DOP-PCR: degenerative-oligonucleotide-PCR; IVT: In vitro transcription
Single-cell transcriptomics
The first study of single-cell RNA transcriptome of mouse blastomere detected novel splice junctions and
expression of more genes than previous microarray studies . However, this method was found to have a
[82]
strong 3’ bias due to the inefficiency of first-strand cDNA synthesis by reverse transcriptase. To overcome
this problem, Smart-seq technique was developed using MMLV reverse transcriptase with template switch-
ing activity [Table 1] [83,84] . This Smart-seq method utilizes an intrinsic property of MMLV to add three to
four cytosines specifically to the 3’ end of the first cDNA strand, which is subsequently used to anchor a uni-
[85]
versal PCR primer for amplification . In a single-cell RNA-seq of CTCs from melanoma patients, Smart-
seq has improved read coverage across transcripts despite increased noise in gene expression estimates .
[83]
Moreover, distinct gene expression patterns including candidate biomarkers for melanoma CTCs were re-
ported in this study .
[83]
In vitro transcription (IVT) -based linear RNA amplification uses T7 RNA polymerase to produce tran-
scripts with high specificity and low error rate [Table 1], it has the drawback of lower efficiency and is biased
[86]
towards the 3’ end of input transcripts . CEL-Seq method of pooling cells and libraries reduced some of
the limitations of IVT and was used to capture differential gene expression in two-cell stage embryo of C.
elegans [87,88] .
The third strategy used Phi29 DNA polymerase for cDNA library generation from single cells [Table 1] [89,90] .
RNA is reverse transcribed, circularized and then amplified using Phi29 polymerase which preserves full-
length transcript coverage. Additionally, random primers can be incorporated to generate cDNA, making
[89]
this method suitable for prokaryotes .
A combined method of single-cell isolation and single-cell sequencing
Microfluidic devices for single-cell isolation coupled with single-cell RT-qPCR or whole transcriptome has
been developed by multiple groups [91-93] . A good example is a microfluidic device developed by White et al. [94,95]
capable of performing high precision RT-qPCR measurements of gene expression from hundreds of single
cells per run. This device combines cell loading, cell lysis, reverse transcription and quantitative PCR in one
cell processing unit [Figure 4Ci] [94,95] . Once cells are loaded, a single cell is trapped in a cell capture chamber
[Figure 4Ci] [94,95] . After cell lysis, the transcript target is reverse transcribed before being injected into the
PCR chamber . Master mixes for RT and qPCR are loaded onto the common feed channel sequentially to
[94]
enable each reaction step. A similar device, featuring additional cell processing chambers and sample elu-
tion capabilities has been released as a commercial product (Fluidigm C1) in 2012. Since then, an increasing
number of studies investigated ITH using Fluidigm’s microfluidic device [96-98] .
Efforts to reduce amplification bias by incorporating unique molecular identifiers before transcriptome am-