
Page 78 - Read Online
P. 78
Lv et al. Intell Robot 2022;2(2):16879 I http://dx.doi.org/10.20517/ir.2022.09 Page 176
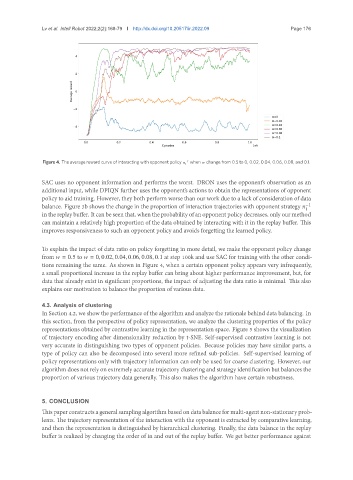
−1
Figure 4. The average reward curve of interacting with opponent policy when change from 0.5 to 0, 0.02, 0.04, 0.06, 0.08, and 0.1.
1
SAC uses no opponent information and performs the worst. DRON uses the opponent’s observation as an
additional input, while DPIQN further uses the opponent’s actions to obtain the representations of opponent
policy to aid training. However, they both perform worse than our work due to a lack of consideration of data
balance. Figure 3b shows the change in the proportion of interaction trajectories with opponent strategy −1
1
in the replay buffer. It can be seen that, when the probability of an opponent policy decreases, only our method
can maintain a relatively high proportion of the data obtained by interacting with it in the replay buffer. This
improves responsiveness to such an opponent policy and avoids forgetting the learned policy.
To explain the impact of data ratio on policy forgetting in more detail, we make the opponent policy change
from = 0.5 to = 0, 0.02, 0.04, 0.06, 0.08, 0.1 at step 100k and use SAC for training with the other condi-
tions remaining the same. As shown in Figure 4, when a certain opponent policy appears very infrequently,
a small proportional increase in the replay buffer can bring about higher performance improvement, but, for
data that already exist in significant proportions, the impact of adjusting the data ratio is minimal. This also
explains our motivation to balance the proportion of various data.
4.3. Analysis of clustering
In Section 4.2, we show the performance of the algorithm and analyze the rationale behind data balancing. In
this section, from the perspective of policy representation, we analyze the clustering properties of the policy
representations obtained by contrastive learning in the representation space. Figure 5 shows the visualization
of trajectory encoding after dimensionality reduction by t-SNE. Self-supervised contrastive learning is not
very accurate in distinguishing two types of opponent policies. Because policies may have similar parts, a
type of policy can also be decomposed into several more refined sub-policies. Self-supervised learning of
policy representations only with trajectory information can only be used for coarse clustering. However, our
algorithm does not rely on extremely accurate trajectory clustering and strategy identification but balances the
proportion of various trajectory data generally. This also makes the algorithm have certain robustness.
5. CONCLUSION
Thispaperconstructs ageneral samplingalgorithmbasedondata balanceformulti-agentnon-stationaryprob-
lems. The trajectory representation of the interaction with the opponent is extracted by comparative learning,
and then the representation is distinguished by hierarchical clustering. Finally, the data balance in the replay
buffer is realized by changing the order of in and out of the replay buffer. We get better performance against