
Page 15 - Read Online
P. 15
Page 138 Liu et al. Intell Robot 2023;3(2):131-43 I http://dx.doi.org/10.20517/ir.2023.07
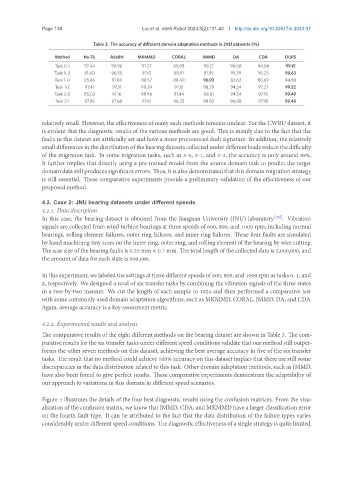
Table 3. The accuracy of different domain adaptation methods in JNU datasets (%)
Method No-TL AdaBN MKMMD CORAL JMMD DA CDA OURS
Task 0-1 97.44 96.96 97.27 89.08 98.12 96.08 94.54 99.15
Task 0-2 91.60 96.55 97.61 88.91 97.95 95.39 96.25 98.63
Task 1-0 85.46 91.88 88.57 88.40 96.93 83.62 86.69 94.88
Task 1-2 97.41 97.51 98.29 97.61 98.29 94.54 97.27 99.32
Task 2-0 85.02 91.16 98.46 97.44 98.81 94.54 97.10 99.49
Task 2-1 97.95 97.68 97.61 96.25 98.63 96.08 97.95 99.49
relatively small. However, the effectiveness of many such methods remains unclear. For the CWRU dataset, it
is evident that the diagnostic results of the various methods are good. This is mainly due to the fact that the
faults in this dataset are artificially set and have a more pronounced fault signature. In addition, the relatively
small differences in the distribution of the bearing datasets collected under different loads reduce the difficulty
of the migration task. In some migration tasks, such as 3-0, 3-1, and 3-2, the accuracy is only around 85%.
It further implies that directly using a pre-trained model from the source domain task to predict the target
domain data still produces significant errors. Thus, it is also demonstrated that this domain migration strategy
is still essential. These comparative experiments provide a preliminary validation of the effectiveness of our
proposed method.
4.2. Case 2: JNU bearing datasets under different speeds
4.2.1. Data description
In this case, the bearing dataset is obtained from the Jiangnan University (JNU) laboratory [26] . Vibration
signals are collected from wind turbine bearings at three speeds of 600, 800, and 1000 rpm, including normal
bearings, rolling element failures, outer ring failures, and inner ring failures. These four faults are simulated
by hand machining tiny scars on the inner ring, outer ring, and rolling element of the bearing by wire cutting.
The scar size of the bearing faults is 0.25 mm × 0.7 mm. The total length of the collected data is 2,000,000, and
the amount of data for each state is 500,000.
In this experiment, we labeled the settings at three different speeds of 600, 800, and 1000 rpm as tasks 0, 1, and
2, respectively. We designed a total of six transfer tasks by combining the vibration signals of the three states
in a two-by-two manner. We cut the length of each sample to 1024 and then performed a comparative test
with some commonly used domain adaptation algorithms, such as MKMMD, CORAL, JMMD, DA, and CDA.
Again, average accuracy is a key assessment metric.
4.2.2. Experimental results and analysis
The comparative results of the eight different methods on the bearing dataset are shown in Table 3. The com-
parative results for the six transfer tasks under different speed conditions validate that our method still outper-
forms the other seven methods on this dataset, achieving the best average accuracy in five of the six transfer
tasks. The result that no method could achieve 100% accuracy on this dataset implies that there are still some
discrepancies in the data distribution related to this task. Other domain adaptation methods, such as JMMD,
have also been found to give perfect results. These comparative experiments demonstrate the adaptability of
our approach to variations in this domain in different speed scenarios.
Figure 3 illustrates the details of the four best diagnostic results using the confusion matrices. From the visu-
alization of the confusion matrix, we know that JMMD, CDA, and MKMMD have a larger classification error
on the fourth fault type. It can be attributed to the fact that the data distribution of the failure types varies
considerably under different speed conditions. The diagnostic effectiveness of a single strategy is quite limited.