
Page 20 - Read Online
P. 20
Page 164 Ji et al. Intell Robot 2021;1(2):151-75 https://dx.doi.org/10.20517/ir.2021.14
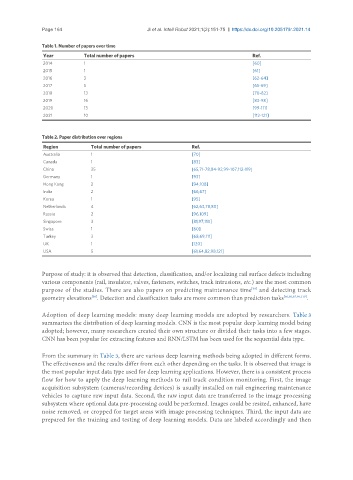
Table 1. Number of papers over time
Year Total number of papers Ref.
2014 1 [60]
2015 1 [61]
2016 3 [62-64]
2017 5 [65-69]
2018 13 [70-82]
2019 16 [83-98]
2020 13 [99-111]
2021 10 [112-121]
Table 2. Paper distribution over regions
Region Total number of papers Ref.
Australia 1 [70]
Canada 1 [83]
China 35 [65,71-78,84-92,99-107,112-119]
Germany 1 [93]
Hong Kong 2 [94,108]
India 2 [66,67]
Korea 1 [95]
Netherlands 4 [62,63,78,80]
Russia 2 [96,109]
Singapore 3 [81,97,110]
Swiss 1 [60]
Turkey 3 [68,69,111]
UK 1 [120]
USA 5 [61,64,82,98,121]
Purpose of study: it is observed that detection, classification, and/or localizing rail surface defects including
various components (rail, insulator, valves, fasteners, switches, track intrusions, etc.) are the most common
purpose of the studies. There are also papers on predicting maintenance time and detecting track
[99]
[98]
geometry elevations . Detection and classification tasks are more common than prediction tasks [60,80,87,99,119] .
Adoption of deep learning models: many deep learning models are adopted by researchers. Table 3
summarizes the distribution of deep learning models. CNN is the most popular deep learning model being
adopted; however, many researchers created their own structure or divided their tasks into a few stages.
CNN has been popular for extracting features and RNN/LSTM has been used for the sequential data type.
From the summary in Table 3, there are various deep learning methods being adopted in different forms.
The effectiveness and the results differ from each other depending on the tasks. It is observed that image is
the most popular input data type used for deep learning applications. However, there is a consistent process
flow for how to apply the deep learning methods to rail track condition monitoring. First, the image
acquisition subsystem (cameras/recording devices) is usually installed on rail engineering maintenance
vehicles to capture raw input data. Second, the raw input data are transferred to the image processing
subsystem where optional data pre-processing could be performed. Images could be resized, enhanced, have
noise removed, or cropped for target areas with image processing techniques. Third, the input data are
prepared for the training and testing of deep learning models. Data are labeled accordingly and then