
Page 700 - Read Online
P. 700
Merle et al. Hepatoma Res 2020;6:60 I http://dx.doi.org/10.20517/2394-5079.2020.52 Page 5 of 10
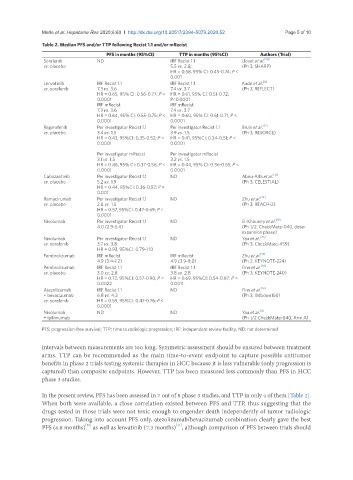
Table 2. Median PFS and/or TTP following Recist 1.1 and/or mRecist
PFS in months (95%CI) TTP in months (95%CI) Authors (Trial)
Sorafenib ND IRF Recist 1.1 Llovet et al. [10]
vs. placebo 5.5 vs. 2.8; (Ph 3, SHARP)
HR = 0.58, 95% CI: 0.45-0.74; P <
0.001
Lenvatinib IRF Recist 1.1 IRF Recist 1.1 Kudo et al. [11]
vs. sorafenib 7.3 vs. 3.6 7.4 vs. 3.7 (Ph 3, REFLECT)
HR = 0.65, 95% CI: 0.56-0.77; P < HR = 0.61, 95% CI: 0.51-0.72;
0.0001 P<0.0001
IRF mRecist IRF mRecist
7.3 vs. 3.6 7.4 vs. 3.7
HR = 0.64, 95% CI: 0.55-0.75; P < HR = 0.60, 95% CI: 0.51-0.71; P <
0.0001 0.0001
Regorafenib Per investigator Recist 1.1 Per investigator Recist 1.1 Bruix et al. [12]
vs. placebo 3.4 vs. 1.5 3.9 vs. 1.5 (Ph 3, RESORCE)
HR = 0.43, 95%CI: 0.35-0.52; P < HR = 0.41, 95%CI: 0.34-0.51; P <
0.0001 0.0001
Per investigator mRecist Per investigator mRecist
3.1 vs. 1.5 3.2 vs. 1.5
HR = 0.46, 95% CI: 0.37-0.56; P < HR = 0.44, 95% CI: 0.36-0.55; P <
0.0001 0.0001
Cabozantinib Per investigator Recist 1.1 ND Abou-Alfa et al. [13]
vs. placebo 5.2 vs. 1.9 (Ph 3, CELESTIAL)
HR = 0.44, 95%CI: 0.36-0.52; P <
0.001
Ramucirumab Per investigator Recist 1.1 ND Zhu et al. [14]
vs. placebo 2.8 vs. 1.5 (Ph 3, REACH-2)
HR = 0.57, 95%CI: 0.47-0.69; P <
0.0001
Nivolumab Per investigator Recist 1.1 ND El-Khoueiry et al. [19]
4.0 (2.9-5.4) (Ph 1/2, CheckMate-040, dose-
expansion phase)
Nivolumab Per investigator Recist 1.1 ND Yau et al. [20]
vs. sorafenib 3.7 vs. 3.8 (Ph 3, CheckMate-459)
HR = 0.93, 95%CI: 0.79-1.10
Pembrolizumab IRF mRecist IRF mRecist Zhu et al. [17]
4.9 (3.4-7.2) 4.9 (3.9-8.0) (Ph 2, KEYNOTE-224)
Pembrolizumab IRF Recist 1.1 IRF Recist 1.1 Finn et al. [18]
vs. placebo 3.0 vs. 2.8 3.8 vs. 2.8 (Ph 3, KEYNOTE-240)
HR = 0.72, 95%CI: 0.57-0.90; P = HR = 0.69, 95%CI: 0.54-0.87; P =
0.0022 0.0011
Atezolizumab IRF Recist 1.1 ND Finn et al. [16]
+ bevacizumab 6.8 vs. 4.3 (Ph 3, IMbrave150)
vs. sorafenib HR = 0.59, 95%CI: 0.47-0.76; P <
0.0001
Nivolumab ND ND Yau et al. [8]
+ ipilimumab (Ph 1/2 CheckMate-040, Arm A)
PFS: progression-free survival; TTP: time to radiologic progression; IRF: independent review facility; ND: not determined
intervals between measurements are too long. Symmetric assessment should be ensured between treatment
arms. TTP can be recommended as the main time-to-event endpoint to capture possible antitumor
benefits in phase 2 trials testing systemic therapies in HCC because it is less vulnerable (only progression is
captured) than composite endpoints. However, TTP has been measured less commonly than PFS in HCC
phase 3 studies.
In the present review, PFS has been assessed in 7 out of 8 phase 3 studies, and TTP in only 4 of them [Table 2].
When both were available, a close correlation existed between PFS and TTP, thus suggesting that the
drugs tested in those trials were not toxic enough to engender death independently of tumor radiologic
progression. Taking into account PFS only, atezolizumab/bevacizumab combination clearly gave the best
[16]
[11]
PFS (6.8 months) as well as lenvatinib (7.3 months) , although comparison of PFS between trials should