
Page 388 - Read Online
P. 388
Page 4 of 10 Sempokuya et al. Hepatoma Res 2019;5:38 I http://dx.doi.org/10.20517/2394-5079.2019.013
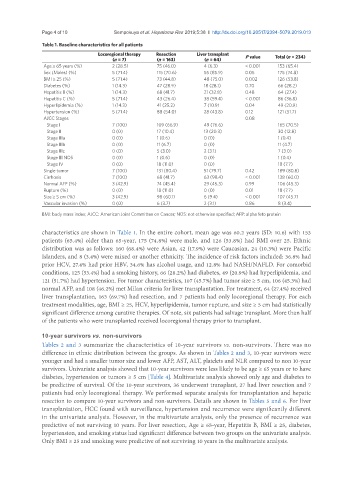
Table 1. Baseline characteristics for all patients
Locoregional therapy Resection Liver transplant
(n = 7) (n = 163) (n = 64) P value Total (n = 234)
Age ≥ 65 years (%) 2 (28.5) 75 (46.0) 4 (6.3) < 0.001 153 (65.4)
Sex (Males) (%) 5 (71.4) 115 (70.6) 55 (85.9) 0.05 175 (74.8)
BMI ≥ 25 (%) 5 (71.4) 73 (44.8) 48 (75.0) 0.002 126 (53.8)
Diabetes (%) 1 (14.3) 47 (28.9) 18 (28.1) 0.70 66 (28.2)
Hepatitis B (%) 1 (14.3) 68 (41.7) 21 (32.8) 0.48 64 (27.4)
Hepatitis C (%) 5 (71.4) 43 (26.4) 38 (59.4) < 0.001 86 (36.8)
Hyperlipidemia (%) 1 (14.3) 41 (25.2) 7 (10.9) 0.04 49 (20.9)
Hypertension (%) 5 (71.4) 88 (54.0) 28 (43.8) 0.12 121 (51.7)
AJCC Stages 0.08
Stage I 7 (100) 109 (66.9) 49 (76.6) 165 (70.5)
Stage II 0 (0) 17 (10.4) 13 (20.3) 30 (12.8)
Stage IIIa 0 (0) 1 (0.6) 0 (0) 1 (0.4)
Stage IIIb 0 (0) 11 (6.7) 0 (0) 11 (4.7)
Stage IIIc 0 (0) 5 (3.0) 2 (3.1) 7 (3.0)
Stage III NOS 0 (0) 1 (0.6) 0 (0) 1 (0.4)
Stage IV 0 (0) 18 (11.0) 0 (0) 18 (7.7)
Single tumor 7 (100) 131 (80.4) 51 (79.7) 0.42 189 (80.8)
Cirrhosis 7 (100) 68 (41.7) 63 (98.4) < 0.001 138 (60.0)
Normal AFP (%) 3 (42.9) 74 (45.4) 29 (45.3) 0.99 106 (45.3)
Rupture (%) 0 (0) 18 (11.0) 0 (0) 0.01 18 (7.7)
Size ≥ 5 cm (%) 3 (42.9) 98 (60.1) 6 (9.4) < 0.001 107 (45.7)
Vascular invasion (%) 0 (0) 6 (3.7) 2 (3.1) 0.86 8 (3.4)
BMI: body mass index; AJCC: American Joint Committee on Cancer; NOS: not otherwise specified; AFP: alpha feto protein
characteristics are shown in Table 1. In the entire cohort, mean age was 60.2 years (SD: 10.6) with 153
patients (65.4%) older than 65-year, 175 (74.8%) were male, and 126 (53.8%) had BMI over 25. Ethnic
distribution was as follows: 160 (68.4%) were Asian, 42 (17.9%) were Caucasian, 24 (10.3%) were Pacific
Islanders, and 8 (3.4%) were mixed or another ethnicity. The incidence of risk factors included: 36.8% had
prior HCV, 27.4% had prior HBV, 34.6% has alcohol usage, and 12.8% had NASH/NAFLD. For comorbid
conditions, 125 (53.4%) had a smoking history, 66 (28.2%) had diabetes, 49 (20.9%) had hyperlipidemia, and
121 (51.7%) had hypertension. For tumor characteristics, 107 (45.7%) had tumor size ≥ 5 cm, 106 (45.3%) had
normal AFP, and 108 (46.2%) met Milan criteria for liver transplantation. For treatment, 64 (27.4%) received
liver transplantation, 163 (69.7%) had resection, and 7 patients had only locoregional therapy. For each
treatment modalities, age, BMI ≥ 25, HCV, hyperlipidemia, tumor rupture, and size ≥ 5 cm had statistically
significant difference among curative therapies. Of note, six patients had salvage transplant. More than half
of the patients who were transplanted received locoregional therapy prior to transplant.
10-year survivors vs. non-survivors
Tables 2 and 3 summarize the characteristics of 10-year survivors vs. non-survivors. There was no
difference in ethnic distribution between the groups. As shown in Tables 2 and 3, 10-year survivors were
younger and had a smaller tumor size and lower AFP, AST, ALT, platelets and NLR compared to non 10-year
survivors. Univariate analysis showed that 10-year survivors were less likely to be age ≥ 65 years or to have
diabetes, hypertension or tumors ≥ 5 cm [Table 4]. Multivariate analysis showed only age and diabetes to
be predictive of survival. Of the 10-year survivors, 36 underwent transplant, 27 had liver resection and 7
patients had only locoregional therapy. We performed separate analysis for transplantation and hepatic
resection to compare 10-year survivors and non-survivors. Details are shown in Tables 5 and 6. For liver
transplantation, HCC found with surveillance, hypertension and recurrence were significantly different
in the univariate analysis. However, in the multivariate analysis, only the presence of recurrence was
predictive of not surviving 10 years. For liver resection, Age ≥ 65-year, Hepatitis B, BMI ≥ 25, diabetes,
hypertension, and smoking status had significant difference between two groups on the univariate analysis.
Only BMI ≥ 25 and smoking were predictive of not surviving 10 years in the multivariate analysis.