
Page 157 - Read Online
P. 157
Yang et al. Hepatoma Res 2019;5:13 I http://dx.doi.org/10.20517/2394-5079.2019.04 Page 3 of 9
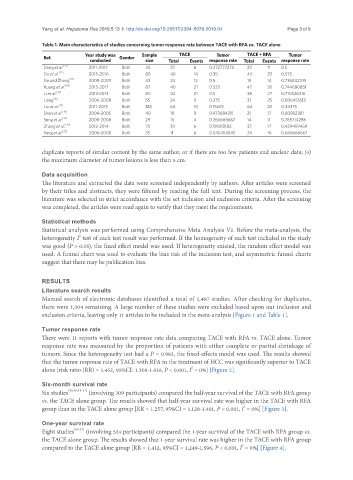
Table 1. Main characteristics of studies concerning tumor response rate between TACE with RFA vs. TACE alone
Year study was Sample TACE Tumor TACE + RFA Tumor
Ref. Gender
conducted size Total Events response rate Total Events response rate
Dong et al. [11] 2011-2012 Both 44 22 6 0.272727273 22 11 0.5
Du et al. [12] 2015-2016 Both 80 40 14 0.35 40 23 0.575
Ge and Zhang [13] 2008-2009 Both 43 24 12 0.5 19 14 0.736842105
Kuang et al. [14] 2015-2017 Both 87 40 21 0.525 47 35 0.744680851
Li et al. [15] 2012-2013 Both 80 42 21 0.5 38 27 0.710526316
Liang [16] 2006-2008 Both 55 24 9 0.375 31 25 0.806451613
Liu et al. [17] 2011-2013 Both 128 64 10 0.15625 64 22 0.34375
Shen et al. [18] 2004-2005 Both 40 19 9 0.473684211 21 17 0.80952381
Song et al. [19] 2006-2008 Both 29 15 4 0.266666667 14 11 0.785714286
Zhang et al. [20] 2012-2014 Both 70 33 6 0.181818182 37 17 0.459459459
Yang et al. [21] 2006-2008 Both 35 11 6 0.545454545 24 16 0.666666667
duplicate reports of similar content by the same author, or if there are too few patients and unclear data; (4)
the maximum diameter of tumor lesions is less than 5 cm.
Data acquisition
The literature and extracted the data were screened independently by authors. After articles were screened
by their titles and abstracts, they were filtered by reading the full text. During the screening process, the
literature was selected in strict accordance with the set inclusion and exclusion criteria. After the screening
was completed, the articles were read again to verify that they meet the requirements.
Statistical methods
Statistical analysis was performed using Comprehensive Meta Analysis V2. Before the meta-analysis, the
2
heterogeneity I test of each test result was performed. If the homogeneity of each test included in the study
was good (P > 0.05), the fixed effect model was used. If heterogeneity existed, the random effect model was
used. A funnel chart was used to evaluate the bias risk of the inclusion test, and asymmetric funnel charts
suggest that there may be publication bias.
RESULTS
Literature search results
Manual search of electronic databases identified a total of 1,487 studies. After checking for duplicates,
there were 1,304 remaining. A large number of these studies were excluded based upon our inclusion and
exclusion criteria, leaving only 11 articles to be included in the meta-analysis [Figure 1 and Table 1].
Tumor response rate
There were 11 reports with tumor response rate data comparing TACE with RFA vs. TACE alone. Tumor
response rate was measured by the proportion of patients with either complete or partial shrinkage of
tumors. Since the heterogeneity test had a P = 0.983, the fixed-effects model was used. The results showed
that the tumor response rate of TACE with RFA in the treatment of HCC was significantly superior to TACE
2
alone [risk ratio (RR) = 1.452, 95%CI: 1.308-1.610, P < 0.001, I = 0%] [Figure 2].
Six-month survival rate
Six studies [15,16,18-21] (involving 309 participants) compared the half-year survival of the TACE with RFA group
vs. the TACE alone group. The results showed that half-year survival rate was higher in the TACE with RFA
2
group than in the TACE alone group [RR = 1.257, 95%CI = 1.128-1.401, P < 0.001, I = 0%] [Figure 3].
One-year survival rate
Eight studies [14-21] (involving 524 participants) compared the 1-year survival of the TACE with RFA group vs.
the TACE alone group. The results showed that 1-year survival rate was higher in the TACE with RFA group
2
compared to the TACE alone group [RR = 1.412, 95%CI = 1.249-1.596, P < 0.001, I = 0%] [Figure 4].