
Page 16 - Read Online
P. 16
Nishioka et al. Hepatoma Res 2018;4:1 I http://dx.doi.org/10.20517/2394-5079.2017.46 Page 5 of 12
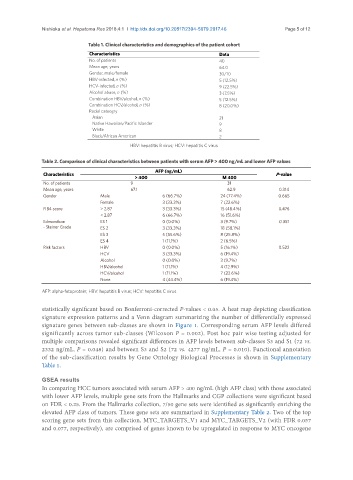
Table 1. Clinical characteristics and demographics of the patient cohort
Characteristics Data
No. of patients 40
Mean age, years 64.0
Gender, male/female 30/10
HBV-infected, n (%) 5 (12.5%)
HCV-infected, n (%) 9 (22.5%)
Alcohol abuse, n (%) 3 (7.5%)
Combination HBV/alcohol, n (%) 5 (12.5%)
Combination HCV/alcohol, n (%) 8 (20.0%)
Racial cateogry
Asian 21
Native Hawaiian/Pacific Islander 9
White 8
Black/African American 2
HBV: hepatitis B virus; HCV: hepatitis C virus
Table 2. Comparison of clinical characteristics between patients with serum AFP > 400 ng/mL and lower AFP values
AFP (ng/mL)
Characteristics P-value
> 400 ≤ 400
No. of patients 9 31
Mean age, years 67.1 62.9 0.314
Gender Male 6 (66.7%) 24 (77.4%) 0.665
Female 3 (33.3%) 7 (22.6%)
FIB4 score > 2.87 3 (33.3%) 15 (48.4%) 0.476
< 2.87 6 (66.7%) 16 (51.6%)
Edmondson ES 1 0 (0.0%) 3 (9.7%) 0.351
- Steiner Grade ES 2 3 (33.3%) 18 (58.1%)
ES 3 5 (55.6%) 8 (25.8%)
ES 4 1 (11.1%) 2 (6.5%)
Risk factors HBV 0 (0.0%) 5 (16.1%) 0.522
HCV 3 (33.3%) 6 (19.4%)
Alcohol 0 (0.0%) 3 (9.7%)
HBV/alcohol 1 (11.1%) 4 (12.9%)
HCV/alcohol 1 (11.1%) 7 (22.6%)
None 4 (44.4%) 6 (19.4%)
AFP: alpha-fetoprotein; HBV: hepatitis B virus; HCV: hepatitis C virus
statistically significant based on Bonferroni-corrected P-values < 0.05. A heat map depicting classification
signature expression patterns and a Venn diagram summarizing the number of differentially expressed
signature genes between sub-classes are shown in Figure 1. Corresponding serum AFP levels differed
significantly across tumor sub-classes (Wilcoxon P = 0.002). Post hoc pair wise testing adjusted for
multiple comparisons revealed significant differences in AFP levels between sub-classes S3 and S1 (72 vs.
2332 ng/mL, P = 0.048) and between S3 and S2 (72 vs. 4277 ng/mL, P = 0.010). Functional annotation
of the sub-classification results by Gene Ontology Biological Processes is shown in Supplementary
Table 1.
GSEA results
In comparing HCC tumors associated with serum AFP > 400 ng/mL (high AFP class) with those associated
with lower AFP levels, multiple gene sets from the Hallmarks and CGP collections were significant based
on FDR < 0.25. From the Hallmarks collection, 7/50 gene sets were identified as significantly enriching the
elevated AFP class of tumors. These gene sets are summarized in Supplementary Table 2. Two of the top
scoring gene sets from this collection, MYC_TARGETS_V1 and MYC_TARGETS_V2 (with FDR 0.057
and 0.077, respectively), are comprised of genes known to be upregulated in response to MYC oncogene