
Page 37 - Read Online
P. 37
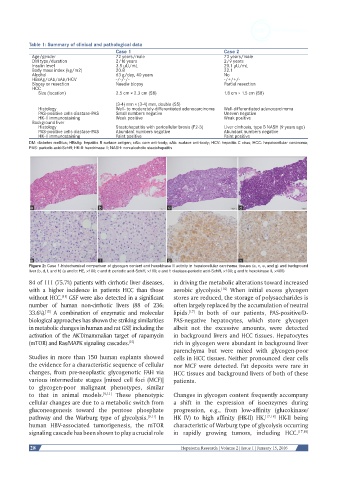
Table 1: Summary of clinical and pathological data
                                          Case 1                                Case 2
            Age/gender                    72 years/male                         73 years/male
            DM type/duration              2/16 years                            2/9 years
            Insulin level                 3.5 μU/mL                             20.1 μU/mL
            Body mass index (kg/m2)       20.8                                  22.1
            Alcohol                       63 g/day, 40 years                    No
            HBsAg/cAb/sAb/HCV             -/-/-/-                               -/+/+/-
            Biopsy or resection           Needle biopsy                         Partial resection
            HCC
              Size (location)             2.5 cm × 2.3 cm (S8)                  1.8 cm × 1.5 cm (S8)
                                          (3-4) mm × (3-4) mm, double (S5)
              Histology                   Well- to moderately-differentiated adenocarcinoma  Well-differentiated adenocarcinoma
              PAS-positive cells diastase-PAS  Small numbers negative           Uneven negative
              HK-II immunostaining        Weak positive                         Weak positive
            Background liver
              Histology                   Steatohepatitis with pericellular brosis (F2-3)  Liver cirrhosis, type B NASH (9 years ago)
              PAS-positive cells diastase-PAS  Abundant numbers negative        Abundant numbers negative
              HK-II immunostaining        Faint positive                        Faint positive
           DM: diabetes mellitus; HBsAg: hepatitis B surface antigen; cAb: core anti-body; sAb: surface anti-body; HCV: hepatitis C virus; HCC: hepatocellular carcinoma;
           PAS: periodic acid-Schiff; HK-II: hexokinase II; NASH: non-alcoholic steatohepatitis


           Figure 2: Case 1-histochemical comparison of glycogen content and hexokinase II activity in hepatocellular carcinoma tissues (a, c, e, and g) and background
           liver (b, d, f, and h) (a and b: HE, ×100; c and d: periodic acid-Schiff, ×100; e and f: diastase-periodic acid-Schiff, ×100; g and h: hexokinase II, ×400)
           84 of 111 (75.7%) patients with cirrhotic liver diseases,   in driving the metabolic alterations toward increased
           with a higher incidence in patients HCC than those   aerobic glycolysis.  When initial excess glycogen
                                                                               [16]
           without HCC.  GSF were also detected in a significant   stores are reduced, the storage of polysaccharides is
                       [11]
           number of  human non-cirrhotic livers (88 of 236;   often largely replaced by the accumulation of neutral
                                                                   [17]
                 [15]
           33.6%).   A  combination  of  enzymatic  and  molecular   lipids.  In both of our patients,  PAS-positive/D-
           biological approaches has shown the striking similarities   PAS-negative  hepatocytes, which store glycogen
           in metabolic changes in human and rat GSF, including the   albeit  not the excessive amounts, were detected
           activation of the AKT/mammalian target of rapamycin   in background livers and HCC tissues. Hepatocytes
           (mTOR) and Ras/MAPK signaling cascades. [15]       rich in glycogen were abundant in background liver
                                                              parenchyma  but were mixed with  glycogen-poor
           Studies in more than 150 human explants showed     cells in HCC tissues. Neither pronounced clear cells
           the evidence for a characteristic sequence of cellular   nor  MCF  were  detected.  Fat  deposits  were  rare  in
           changes,  from  pre-neoplastic glycogenotic  FAH  via   HCC tissues and background livers of both of these
           various intermediate stages [mixed cell foci (MCF)]   patients.
           to glycogen-poor malignant phenotypes, similar
           to that in animal  models. [9,11]  These  phenotypic   Changes in glycogen content frequently accompany
           cellular changes are due to a metabolic switch from   a shift in the expression of isoenzymes  during
           gluconeogenesis toward the pentose phosphate       progression,  e.g.,  from  low-affinity  (glucokinase/
           pathway and the Warburg type of glycolysis. [9,11]  In   HK  IV)  to high  affinity  (HK-II) HK, [17,18]   HK-II  being
           human HBV-associated tumorigenesis,  the mTOR      characteristic of Warburg type of glycolysis occurring
           signaling cascade has been shown to play a crucial role   in  rapidly growing  tumors,  including HCC. [17,19]

            28                                                   Hepatoma Research | Volume 2 | Issue 1 | January 15, 2016