
Page 135 - Read Online
P. 135
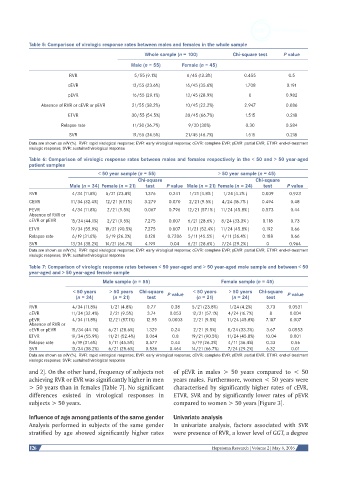
Table 5: Comparison of virologic response rates between males and females in the whole sample
                                                    Whole sample (n = 100)         Chi-square test   P value

                                               Male (n = 55)     Female (n = 45)
                         RVR                    5/55 (9.1%)        6/45 (13.3%)        0.455          0.5
                         cEVR                  13/55 (23.6%)      16/45 (35.6%)        1.708          0.191
                         pEVR                  16/55 (29.1%)      13/45 (28.9%)         0            0.982
                Absence of RVR or cEVR or pEVR  21/55 (38.2%)     10/45 (22.2%)        2.947         0.086

                         ETVR                  30/55 (54.5%)      30/45 (66.7%)        1.515          0.218
                       Relapse rate            11/30 (36.7%)       9/30 (30%)          0.30          0.584
                         SVR                   19/55 (34.5%)      21/45 (46.7%)        1.515          0.218
           Data are shown as n/N (%). RVR: rapid virological response; EVR: early virological response; cEVR: complete EVR; pEVR: partial EVR; ETVR: end-of-treatment
           virologic response; SVR: sustained virological response
           Table 6: Comparison of virologic response rates between males and females respectively in the < 50 and > 50 year-aged
           patient samples
                                    < 50 year sample (n = 55)                 > 50 year sample (n = 45)
                                                  Chi-square                               Chi-square
                         Male (n = 34) Female (n = 21)  test  P value Male (n = 21) Female (n = 24)  test  P value
           RVR            4/34 (11.8%)  5/21 (23.8%)  1.376  0.241  1/21 (4.8% )  1/24 (4.2% )  0.009  0.923
           CEVR           11/34 (32.4%)  12/21 (57.1%)  3.279  0.070  2/21 (9.5% )  4/24 (16.7% )  0.494  0.48
           PEVR           4/34 (11.8%)  2/21 (9.5%)  0.067  0.796  12/21 (57.1% )  11/24 (45.8% )  0.573  0.44
           Absence of RVR or
           cEVR or pEVR   15/34 (44.1%)  2/21 (9.5%)  7.275  0.007  6/21 (28.6% )  8/24 (33.3% )  0.118  0.73
           ETVR           19/34 (55.9%)  19/21 (90.5%)  7.275  0.007  11/21 (52.4% )  11/24 (45.8% )  0.192  0.66
           Relapse rate   6/19 (31.6%)  5/19 (26.3%)  0.128  0.7206  5/11 (45.5% )  4/11 (36.4% )  0.188  0.66
           SVR            13/34 (38.2%)  14/21 (66.7%)  4.199  0.04  6/21 (28.6% )  7/24 (29.2% )  0   0.964
           Data are shown as n/N (%). RVR: rapid virological response; EVR: early virological response; cEVR: complete EVR; pEVR: partial EVR; ETVR: end-of-treatment
           virologic response; SVR: sustained virological response
           Table 7: Comparison of virologic response rates between < 50 year-aged and > 50 year-aged male sample and between < 50
           year-aged and > 50 year-aged female sample
                                     Male sample (n = 55)                      Female sample (n = 45)
                           < 50 years   > 50 years   Chi-square   P value  < 50 years   > 50 years   Chi-square   P value
                            (n = 34)     (n = 21)    test             (n = 21)    (n = 24)     test

           RVR            4/34 (11.8%)  1/21 (4.8%)  0.77    0.38   5/21 (23.8%)  1/24 (4.2%)  3.73   0.0531
           cEVR           11/34 (32.4%)  2/21 (9.5%)  3.74   0.053  12/21 (57.1%)  4/24 (16.7%)  8     0.004
           pEVR           4/34 (11.8%)  12/21 (57.1%)  12.95  0.0003  2/21 (9.5%)  11/24 (45.8%)  7.187  0.007
           Absence of RVR or
           cEVR or pEVR   15/34 (44.1%)  6/21 (28.6%)  1.329  0.24   2/21 (9.5%)  8/24 (33.3%)  3.67  0.0553
           ETVR           19/34 (55.9%)  11/21 (52.4%)  0.064  0.8  19/21 (90.5%)  11/24 (45.8%)  10.04  0.001
           Relapse rate   6/19 (31.6%)  5/11 (45.5%)  0.577  0.44    5/19 (26.3%)  4/11 (36.4%)  0.33  0.56
           SVR            13/34 (38.2%)  6/21 (28.6%)  0.536  0.464  14/21 (66.7%)  7/24 (29.2%)  6.32  0.01
           Data are shown as n/N (%). RVR: rapid virological response; EVR: early virological response; cEVR: complete EVR; pEVR: partial EVR; ETVR: end-of-treatment
           virologic response; SVR: sustained virological response

           and 2]. On the other hand, frequency of subjects not   of pEVR  in  males  > 50 years  compared to < 50
           achieving RVR or EVR was significantly higher in men   years males. Furthermore, women < 50 years were
           > 50 years than in females [Table 7]. No significant   characterised by significantly higher rates of cEVR,
           differences existed in virological responses in    ETVR, SVR and by significantly lower rates of pEVR
           subjects > 50 years.                               compared to women > 50 years [Figure 3].

           Influence of age among patients of the same gender  Univariate analysis
           Analysis performed in subjects of the same gender   In univariate analysis, factors associated with SVR
           stratified by age showed significantly higher rates   were presence of RVR, a lower level of GGT, a degree

           126                                                             Hepatoma Research | Volume 2 | May 6, 2016