
Page 134 - Read Online
P. 134
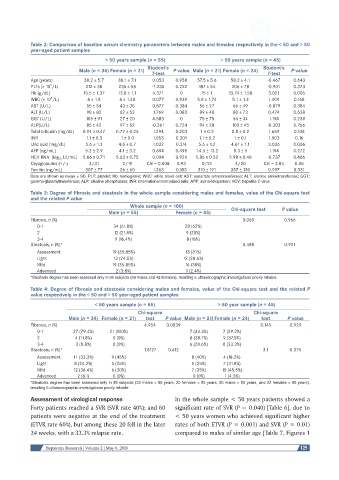
Table 2: Comparison of baseline serum chemistry parameters between males and females respectively in the < 50 and > 50
            year-aged patient samples
                                      < 50 years sample (n = 55)               > 50 years sample (n = 45)
                                                     Student’s                               Student’s
                             Male (n = 34) Female (n = 21)    P value Male (n = 21) Female (n = 24)    P value
                                                      T-test                                   T-test
            Age (years)        38.2 ± 5.7  38.1 ± 7.1  0.053   0.958  57.5 ± 5.6  58.2 ± 4.1   -0.467   0.643
                   9
            PLTs (× 10 /L)     212 ± 38    235 ± 55   -1.235   0.222   187 ± 54   206 ± 78     -0.901   0.373
            Hb (g/dL)         15.5 ± 1.37  13.8 ± 1.1  4.371    0       15 ± 1   13.74 ± 1.58  3.021    0.005
                   9
            WBC (× 10 /L)       6 ± 1.5    6 ± 1.48    0.077   0.939  5.8 ± 1.74   5.1 ± 1.3   1.409    0.168
            AST (U/L)          55 ± 54     43 ± 35     0.877   0.384   56 ± 27     66 ± 49     -0.879   0.384
            ALT (U/L)          98 ± 82     62 ± 52     1.769   0.083   89 ± 48     80 ± 73     0.474    0.638
            GGT (U/L)          105 ± 91    27 ± 20     4.583    0      75 ± 75     54 ± 34     1.194    0.239
            ALP(U/L)           85 ± 42     97 ± 52    -0.361   0.724   94 ± 28    100 ± 45     -0.303   0.766
            Total bilirubin (mg/dL)  0.94 ± 0.47  0.77 ± 0.25  1.294  0.203  1 ± 0.3  0.8 ± 0.2  1.659  0.108
            INR                1.1 ± 0.3   1 ± 0.0     1.053   0.301   1.1 ± 0.2   1 ± 0.1     1.503     0.16
            Uric acid (mg/dL)  5.6 ± 1.3   4.6 ± 0.7   1.032   0.314   5.6 ± 1.2  4.61 ± 1.1   3.036    0.006
            AFP (ng/mL)        5.2 ± 2.9   4.1 ± 3.2   0.694   0.498  1.4.5 ± 13.2  8.3 ± 5    1.194    0.272
            HCV RNA  (log 10  UI/mL)  5.66 ± 0.71  5.63 ± 0.75  0.094  0.926  5.86 ± 0.52  5.98 ± 0.48  -0.737  0.466
            Cryoglobulins (+/-)  3/31       2/19     Chi = 0.008  0.93  0/21        4/20      Chi = 3.84  0.05
            Ferritin (ng/mL)   307 ± 77    26 ± 60     1.363   0.183  310 ± 191   357 ± 130    0.997    0.331
            Data are shown as mean ± SD. PLT: platelet; Hb: hemoglobin; WBC: white blood cell; AST: aspartate aminotransferase; ALT: alanine aminotransferase; GGT:
            gamma-glutamyltransferase; ALP: alkaline phosphatase; INR: international normalized ratio; AFP: alpha-fetoprotein; HCV: hepatitis C virus

            Table 3: Degree of fibrosis and steatosis in the whole sample considering males and females, value of the Chi-square test
            and the related P value
                                               Whole sample (n = 100)
                                       Male (n = 55)           Female (n = 45)    Chi-square test   P value
            Fibrosis, n (%)                                                           0.069          0.966
              0-1                        34 (61.8%)               28 (62%)
              2                          12 (21.8%)               9 (20%)
              3-4                        9 (16.4%)                 8 (18%)
            Steatosis, n (%)*                                                         0.488          0.921
              Assessment                19 (35.85%)               13 (31%)
              Light                      13 (24.5%)              12 (28.6%)
              Mild                      19 (35.85%)               16 (38%)
              Advanced                    2 (3.8%)                1 (2.4%)
            *Steatosis degree has been assessed only in 95 subjects (53 males and 42 females), resulting 5 ultrasonographic investigations poorly reliable

            Table 4: Degree of fibrosis and steatosis considering males and females, value of the Chi-square test and the related P
            value respectively in the < 50 and > 50 year-aged patient samples
                                  < 50 years sample (n = 55)                  > 50 year sample (n = 45)
                                                 Chi-square                               Chi-square
                         Male (n = 34) Female (n = 21)  test  P value Male (n = 21) Female (n = 24)  test  P value
            Fibrosis, n (%)                         4.954  0.0839                            0.145     0.929
              0-1          27 (79.4%)   21 (100%)                   7 (33.3%)  7 (29.2%)
              2            4 (11.8%)     0 (0%)                     8 (38.1%)  9 (37.5%)
              3-4           3 (8.8%)     0 (0%)                     6 (28.6%)  8 (33.3%)
            Steatosis, n (%)*                      1.8127   0.612                            3.1       0.375
              Assessment   11 (33.3%)   9 (45%)                     8 (40%)    4 (18.2%)
              Light        8 (24.2%)    5 (25%)                     5 (25%)    7 (31.8%)
              Mild         12 (36.4%)   6 (30%)                     7 (35%)    10 (45.5%)
              Advanced      2 (6.1)      0 (0%)                      0 (0%)     1 (4.5%)
            *Steatosis degree has been assessed only in 95 subjects (33 males < 50 years, 20 females < 50 years, 20 males > 50 years, and 22 females > 50 years),
            resulting 5 ultrasonographic investigations poorly reliable

            Assessment of virological response                 In the whole sample < 50 years patients showed a
            Forty patients reached a SVR (SVR rate 40%); and 60   significant rate of SVR (P = 0.040) [Table 6], due to
            patients were negative at the end of the treatment   < 50 years women who achieved significant higher
            (ETVR rate 60%), but among these 20 fell in the later   rates of both ETVR (P = 0.001) and SVR (P = 0.01)
            24 weeks, with a 33.3% relapse rate.               compared to males of similar age [Table 7, Figures 1


                 Hepatoma Research | Volume 2 | May 6, 2016                                               125