
Page 133 - Read Online
P. 133
according to the score: < 1.45 was considered as Subjects were followed monthly, until the end of
FO-F1; 1.45-3.25 was considered as F2; > 3.25 was therapy. Thereafter, subjects showing ETVR were
considered as F3-F4. observed during the following 24 weeks, in order
to verify either the persistence SVR or the loss of
Treatment response.
Standard treatment consisted in pegylated IFN
alfa-2a 180 µg s.c. once a week or pegylated IFN Statistical analysis
alfa-2b 1-1.5 µg/kg s.c. once a week plus ribavirin Data were expressed as means ± SD (continuous
(800 mg/day for patients weighing < 70 kg, 1,000 variables) or proportions (categorical values). T-test
mg/day for patients weighing 70-80 kg, 1,200 mg/day and Chi-square test were used to evaluate group
for patients weighing > 80 kg) for 48 weeks. differences in means and proportions, respectively.
Univariate analysis was performed on baseline
In the presence of adverse events, both IFN and parameters to identify factors potentially related
ribavirin doses were reduced by 25% and down to 200 to SVR. All P values were two sided, considering
mg, respectively; both were stopped when hemoglobin statistically significant a P value < 0.05. All analyses
3
< 8.5 g/dL and/or leukocytes count < 2,000 cells/mm were performed with Statistical Package for the
and/or PLTs count < 50,000/mm . Social Science version 20.0.
3
Treatment efficacy was assessed according to rapid RESULTS
virological response (RVR, undetectable HCV RNA Assessment of baseline characteristics
at week 4 of treatment); early virological response Baseline characteristics, laboratory data and the
(EVR), including complete EVR (cEVR, undetectable degree of steatosis and fibrosis are summarized
HCV RNA at week 12 of treatment in the absence in Tables 1-6. Baseline characteristics, laboratory
of RVR) and partial EVR (pEVR, ≥ 2 log reduction data and the degree of both steatosis and fibrosis
of serum HCV RNA at week 12 of therapy compared were comparable in men and women, excepted for
with the baseline level, in the absence of RVR or haemoglobin, GGT and uric acid values, resulted
cEVR); end-of-treatment virologic response (ETVR, significantly higher in men. Similar results were
undetectable HCV RNA at the end of treatment); obtained after stratification of participants by gender
sustained virological response (SVR, HCV RNA and age < or > 50 years; haemoglobin and GGT
negativity at the end of treatment and in the after values were significantly higher in men compared
24 weeks); relapse was defined as undetectable HCV to women both aged less and more than 50 years.
RNA at end of treatment and detectable HCV RNA Cryoglobulins positivity occurred more frequently in
during follow-up. women aged more than 50 years (P = 0.05).
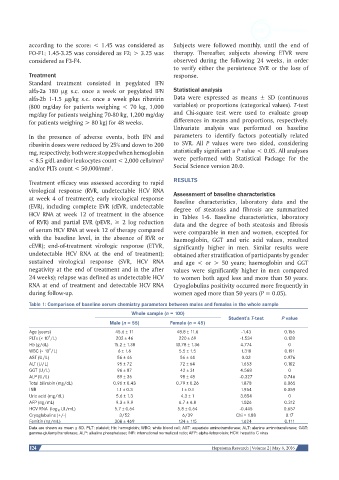
Table 1: Comparison of baseline serum chemistry parameters between males and females in the whole sample
Whole sample (n = 100)
Student's T-test P value
Male (n = 55) Female (n = 45)
Age (years) 45.6 ± 11 48.8 ± 11.6 -1.43 0.156
9
PLTs (× 10 /L) 202 ± 46 220 ± 69 -1.534 0.128
Hb (g/dL) 15.2 ± 1.38 13.78 ± 1.36 4.774 0
9
WBC (× 10 /L) 6 ± 1.6 5.5 ± 1.5 1.318 0.191
AST (U/L) 56 ± 46 56 ± 44 0.03 0.976
ALT (U/L) 95 ± 72 72 ± 64 1.653 0.102
GGT (U/L) 96 ± 87 42 ± 31 4.568 0
ALP (U/L) 89 ± 36 98 ± 48 -0.327 0.746
Total bilirubin (mg/dL) 0.96 ± 0.43 0.79 ± 0.26 1.878 0.065
INR 1.1 ± 0.3 1 ± 0.1 1.954 0.059
Uric acid (mg/dL) 5.6 ± 1.3 4.3 ± 1 3.854 0
AFP (ng/mL) 9.3 ± 9.9 6.7 ± 4.8 1.026 0.312
HCV RNA (log 10 UI/mL) 5.7 ± 0.64 5.8 ± 0.64 -0.445 0.657
Cryoglobulins (+/-) 3/52 6/39 Chi = 1.88 0.17
Ferritin (ng/mL) 308 ± 469 134 ± 115 1.624 0.111
Data are shown as mean ± SD. PLT: platelet; Hb: hemoglobin; WBC: white blood cell; AST: aspartate aminotransferase; ALT: alanine aminotransferase; GGT:
gamma-glutamyltransferase; ALP: alkaline phosphatase; INR: international normalized ratio; AFP: alpha-fetoprotein; HCV: hepatitis C virus
124 Hepatoma Research | Volume 2 | May 6, 2016