
Page 55 - Read Online
P. 55
Page 8 of 12 Armstrong et al. Hepatoma Res 2021;7:18 I http://dx.doi.org/10.20517/2394-5079.2020.118
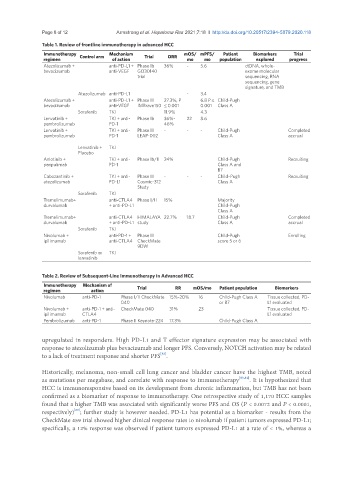
Table 1. Review of frontline immunotherapy in advanced HCC
Immunotherapy Control arm Mechanism Trial ORR mOS/ mPFS/ Patient Biomarkers Trial
regimen of action mo mo population explored progress
Atezolizumab + anti-PD-L1 + Phase Ib 36% - 5.6 ctDNA, whole-
bevacizumab anti-VEGF GO30140 exome molecular
trial sequencing, RNA
sequencing, gene
signature, and TMB
Atezolizumab anti-PD-L1 - 3.4
Atezolizumab + anti-PD-L1 + Phase III 27.3%, P 6.8 P ≤ Child-Pugh
bevacizumab anti-VEGF IMBrave150 ≤ 0.001 0.001 Class A
Sorafenib TKI 11.9% 4.3
Lenvatinib + TKI + anti- Phase Ib 36%- 22 8.6
pembrolizumab PD-1 46%
Lenvatinib + TKI + anti- Phase III - - - Child-Pugh Completed
pembrolizumab PD-1 LEAP-002 Class A accrual
Lenvatinib + TKI
Placebo
Anlotinib + TKI + anti- Phase Ib/II 24% Child-Pugh Recruiting
penpulimab PD-1 Class A and
B7
Cabozantinib + TKI + anti- Phase III - - - Child–Pugh Recruiting
atezolizumab PD-L1 Cosmic-312 Class A
Study
Sorafenib TKI
Tremelimumab+ anti-CTLA4 Phase I/II 15% Majority
durvalumab + anti-PD-L1 Child-Pugh
Class A
Tremelimumab+ anti-CTLA4 HIMALAYA 22.7% 18.7 Child-Pugh Completed
durvalumab + anti-PD-L1 study Class A accrual
Sorafenib TKI
Nivolumab + anti-PD-1 + Phase III Child-Pugh Enrolling
ipilimumab anti-CTLA4 CheckMate score 5 or 6
9DW
Sorafenib or TKI
lenvatinib
Table 2. Review of Subsequent-Line Immunotherapy in Advanced HCC
Immunotherapy Mechanism of
regimen action Trial RR mOS/mo Patient population Biomarkers
Nivolumab anti-PD-1 Phase I/II CheckMate 15%-20% 16 Child-Pugh Class A Tissue collected, PD-
040 or B7 L1 evaluated
Nivolumab + anti-PD-1 + anti- CheckMate 040 31% 23 Tissue collected, PD-
ipilimumab CTLA4 L1 evaluated
Pembrolizumab anti-PD-1 Phase II Keynote-224 17.3% Child-Pugh Class A
upregulated in responders. High PD-L1 and T effector signature expression may be associated with
response to atezolizumab plus bevacizumab and longer PFS. Conversely, NOTCH activation may be related
to a lack of treatment response and shorter PFS .
[82]
Historically, melanoma, non-small cell lung cancer and bladder cancer have the highest TMB, noted
as mutations per megabase, and correlate with response to immunotherapy [83,84] . It is hypothesized that
HCC is immunoresponsive based on its development from chronic inflammation, but TMB has not been
confirmed as a biomarker of response to immunotherapy. One retrospective study of 1,170 HCC samples
found that a higher TMB was associated with significantly worse PFS and OS (P < 0.0072 and P < 0.0001,
[85]
respectively) ; further study is however needed. PD-L1 has potential as a biomarker - results from the
CheckMate 459 trial showed higher clinical response rates to nivolumab if patient tumors expressed PD-L1;
specifically, a 12% response was observed if patient tumors expressed PD-L1 at a rate of < 1%, whereas a