
Page 22 - Read Online
P. 22
Page 4 of 10 Burlone et al. Hepatoma Res 2020;6:3 I http://dx.doi.org/10.20517/2394-5079.2019.37
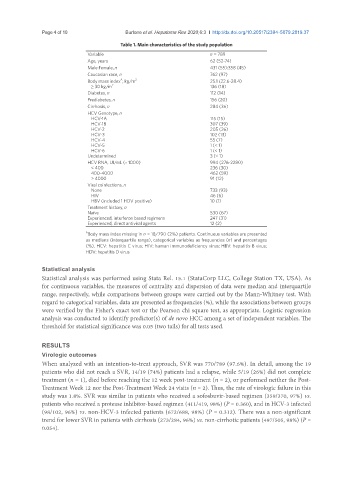
Table 1. Main characteristics of the study population
Variable n = 789
Age, years 62 (52-74)
Male:Female, n 431 (55):358 (45)
Caucasian race, n 762 (97)
A
Body mass index , kg/m 2 25.1 (22.6-28.4)
≥ 30 kg/m 2 136 (18)
Diabetes, n 112 (14)
Prediabetes, n 156 (20)
Cirrhosis, n 284 (36)
HCV Genotype, n
HCV-1A 115 (15)
HCV-1B 307 (39)
HCV-2 205 (26)
HCV-3 102 (13)
HCV-4 55 (7)
HCV-5 1 (< 1)
HCV-6 1 (< 1)
Undetermined 3 (< 1)
HCV RNA, UI/mL (× 1000) 994 (276-2280)
< 400 236 (30)
400-4000 462 (59)
> 4000 91 (12)
Viral coinfections, n
None 733 (93)
HIV 46 (6)
HBV (included 1 HDV positive) 10 (1)
Treatment history, n
Naïve 530 (67)
Experienced, interferon based regimens 247 (31)
Experienced, direct antiviral agents 12 (2)
A Body mass index missing in n = 18/790 (2%) patients. Continuous variables are presented
as medians (interquartile range), categorical variables as frequencies (n) and percentages
(%). HCV: hepatitis C virus; HIV: human immunodeficiency virus; HBV: hepatitis B virus;
HDV: hepatitis D virus
Statistical analysis
Statistical analysis was performed using Stata Rel. 15.1 (StataCorp LLC, College Station TX, USA). As
for continuous variables, the measures of centrality and dispersion of data were median and interquartile
range, respectively, while comparisons between groups were carried out by the Mann-Whitney test. With
regard to categorical variables, data are presented as frequencies (%), while the associations between groups
were verified by the Fisher’s exact test or the Pearson chi square test, as appropriate. Logistic regression
analysis was conducted to identify predictor(s) of de novo HCC among a set of independent variables. The
threshold for statistical significance was 0.05 (two tails) for all tests used.
RESULTS
Virologic outcomes
When analyzed with an intention-to-treat approach, SVR was 770/789 (97.6%). In detail, among the 19
patients who did not reach a SVR, 14/19 (74%) patients had a relapse, while 5/19 (26%) did not complete
treatment (n = 1), died before reaching the 12 week post-treatment (n = 2), or performed neither the Post-
Treatment Week 12 nor the Post-Treatment Week 24 visits (n = 2). Thus, the rate of virologic failure in this
study was 1.8%. SVR was similar in patients who received a sofosbuvir-based regimen (359/370, 97%) vs.
patients who received a protease inhibitor-based regimen (411/419, 98%) (P = 0.360), and in HCV-3 infected
(98/102, 96%) vs. non-HCV-3 infected patients (672/688, 98%) (P = 0.312). There was a non-significant
trend for lower SVR in patients with cirrhosis (273/284, 96%) vs. non-cirrhotic patients (497/505, 98%) (P =
0.054).