
Page 200 - Read Online
P. 200
Molinari et al. Hepatoma Res 2018;4:56 I http://dx.doi.org/10.20517/2394-5079.2018.71 Page 9 of 15
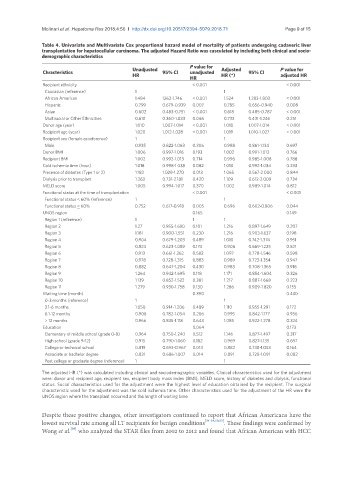
Table 4. Univariate and Multivariate Cox proportional hazard model of mortality of patients undergoing cadaveric liver
transplantation for hepatocellular carcinoma. The adjusted Hazard Ratio was casculated by including both clinical and socio-
demographic characteristics
P value for
Unadjusted Adjusted P value for
Chracteristics HR 95% CI unadjusted HR (*) 95% CI adjusted HR
HR
Recipient ethnicity < 0.001 < 0.001
Caucasian (reference) 1 1
African American 1.484 1262-1.746 < 0.001 1.524 1.283-1.803 < 0.001
Hispanic 0.799 0.679-0.939 0.007 0.785 0.656-0.940 0.008
Asian 0.602 0.483-0.751 < 0.001 0.618 0.485-0.787 < 0.001
Multiracial or Other Ethnicities 0.610 0.360-1.033 0.066 0.733 0.431-1.246 0.251
Donor age (year) 1.010 1.007-1.014 < 0.001 1.010 1.007-1.014 < 0.001
Recipient age (year) 1.020 1.012-1.028 < 0.001 1.019 1.010-1.027 < 0.001
Recipient sex (female as reference) 1 1
Male 0.935 0.822-1.063 0.306 0.988 0.861-1.134 0.697
Donor BMI 1.006 0.997-1.016 0.193 1.002 0.991-1.012 0.766
Recipient BMI 1.002 0.992-1.013 0.714 0.996 0.985-1.008 0.788
Cold ischemia time (hour) 1.018 0.998-1.038 0.082 1.013 0.992-1.034 0.233
Presence of diabetes (Type 1 or 2) 1.182 1.029-1.270 0.013 1.065 0.567-2.000 0.844
Dialysis prior to transplant 1.263 0.731-2.181 0.420 1.109 0.612-2.009 0.734
MELD score 1.005 0.994-1.017 0.370 1.002 0.989-1.014 0.812
Functional status at the time of transplantation < 0.001 < 0.001
Functional status < 60% (reference) 1 1
Functional status > 60% 0.752 0.617-0.918 0.005 0.696 0.602-0.806 0.044
UNOS region 0.165 0.149
Region 1 (reference) 1 1 1
Region 2 1.27 0.955-1.690 0.101 1.216 0.897-1.649 0.207
Region 3 1.181 0.900-1.551 0.230 1.216 0.903-1.637 0.198
Region 4 0.904 0.679-1.203 0.489 1.010 0.742-1.374 0.951
Region 5 0.824 0.623-1.089 0.174 0.906 0.669-1.225 0.521
Region 6 0.913 0.661-1.262 0.582 1.097 0.778-1.546 0.598
Region 7 0.978 0.728-1.315 0.883 0.989 0.723-1.354 0.947
Region 8 0.882 0.647-1.204 0.430 0.983 0.708-1.365 0.918
Region 9 1.264 0.942-1.695 0.118 1.171 0.854-1.604 0.326
Region 10 1.139 0.852-1.522 0.381 1.217 0.887-1.668 0.223
Region 11 1.279 0.930-1.758 0.130 1.286 0.909-1.820 0.155
Waiting time (month) 0.390 0.430
0-3 months (reference) 1 1
3.1-6 months 1.050 0.914-1.206 0.489 1.110 0.955-1.291 0.172
6.1-12 months 0.908 0.782-1.054 0.206 0.995 0.842-1.177 0.956
> 12 months 0.966 0.835-1.118 0.643 1.085 0.922-1.278 0.324
Education 0.064 0.173
Elementary of middle school (grade 0-8) 0.964 0.750-1.240 0.512 1.146 0.877-1.497 0.317
High school (grade 9-12) 0.915 0.790-1.060 0.182 0.969 0.827-1.135 0.697
College or technical school 0.819 0.693-0.967 0.013 0.882 0.738-1.053 0.164
Associate or bachelor degree 0.831 0.686-1.007 0.014 0.891 0.728-1.091 0.082
Post college or graduate degree (reference) 1 1
The adjusted HR (*) was calculated including clinical and sociodemographic variables. Clinical characteristics used for the adjustment
were: donor and recipient age, recipient sex, recipient body mass index (BMI), MELD score, history of diabetes and dialysis, functional
status. Social characteristics used for the adjustment were the highest level of education obtained by the recipient. The surgical
characteristic used for the adjustment was the cold ischemia time. Other characteristics used for the adjustment of the HR were the
UNOS region where the transplant occurred and the length of waiting time
Despite these positive changes, other investigators continued to report that African Americans have the
lowest survival rate among all LT recipients for benign conditions [31-33,50,51] . These findings were confirmed by
[30]
Wong et al. who analyzed the STAR files from 2002 to 2012 and found that African American with HCC