Page 197 - Read Online
P. 197

Page 6 of 15                                             Molinari et al. Hepatoma Res 2018;4:56  I  http://dx.doi.org/10.20517/2394-5079.2018.71


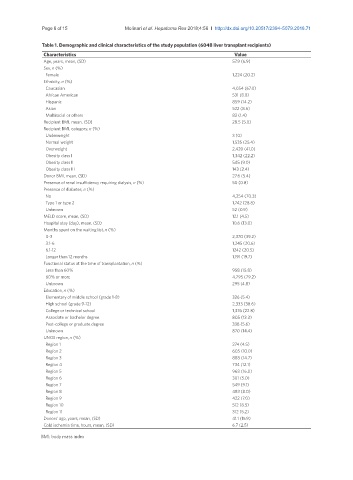
               Table 1. Demographic and clinical characteristics of the study population (6048 liver transplant recipients)
                Characteristics                                                 Value
                Age, years, mean, (SD)                                         57.9 (6.9)
                Sex, n (%)
                  Female                                                       1,224 (20.2)
                Ethnicity, n (%)
                  Caucasian                                                    4,054 (67.0)
                  African American                                             531 (8.8)
                  Hispanic                                                     859 (14.2)
                  Asian                                                        522 (8.6)
                  Multiracial or others                                        82 (1.4)
                Recipient BMI, mean, (SD)                                      28.5 (5.0)
                Recipient BMI, category, n (%)
                  Underweight                                                  3 (0)
                  Normal weight                                                1,535 (25.4)
                  Overweight                                                   2,420 (41.0)
                  Obesity class I                                              1,342 (22.2)
                  Obesity class II                                             545 (9.0)
                  Obesity class III                                            143 (2.4)
                Donor BMI, mean, (SD)                                          27.6 (5.4)
                Presence of renal insufficiency requiring dialysis, n (%)      50 (0.8)
                Presence of diabetes, n (%)
                  No                                                           4,254 (70.3)
                  Type 1 or type 2                                             1,742 (28.8)
                  Unknown                                                      52 (0.9)
                MELD score, mean, (SD)                                         12.1 (4.5)
                Hospital stay (day), mean, (SD)                                10.6 (13.0)
                Months spent on the waiting list, n (%)
                  0-3                                                          2,370 (39.2)
                  3.1-6                                                        1,245 (20.6)
                  6.1-12                                                       1242 (20.5)
                  Longer than 12 months                                        1,191 (19.7)
                Functional status at the time of transplantation, n (%)
                  Less than 60%                                                958 (15.8)
                  60% or more                                                  4,795 (79.2)
                  Unknown                                                      295 (4.8)
                Education, n (%)
                  Elementary of middle school (grade 1-8)                      326 (5.4)
                  High school (grade 9-12)                                     2,333 (38.6)
                  College or technical school                                  1,376 (22.8)
                  Associate or bachelor degree                                 805 (13.3)
                  Post-college or graduate degree                              338 (5.6)
                  Unknown                                                      870 (14.4)
                UNOS region, n (%)
                  Region 1                                                     274 (4.5)
                  Region 2                                                     605 (10.0)
                  Region 3                                                     888 (14.7)
                  Region 4                                                     734 (12.1)
                  Region 5                                                     968 (16.0)
                  Region 6                                                     301 (5.0)
                  Region 7                                                     549 (9.1)
                  Region 8                                                     483 (8.0)
                  Region 9                                                     422 (7.0)
                  Region 10                                                    512 (8.5)
                  Region 11                                                    312 (5.2)
                Donors’ age, years, mean, (SD)                                 41.1 (15.9)
                Cold ischemia time, hours, mean, (SD)                          6.7 (2.5)
               BMI: body mass index
   192   193   194   195   196   197   198   199   200   201   202