Page 198 - Read Online
P. 198

Molinari et al. Hepatoma Res 2018;4:56  I  http://dx.doi.org/10.20517/2394-5079.2018.71                                            Page 7 of 15


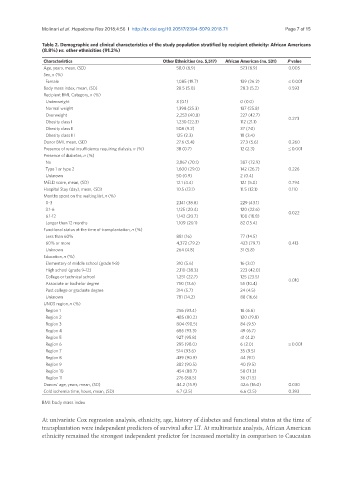
               Table 2. Demographic and clinical characteristics of the study population stratified by recipient ethnicity: African Americans
               (8.8%) vs. other ethnicities (91.2%)
                Characteristics                         Other Ethnicities (no. 5,517)   African American (no. 531)   P value
                Age, years, mean, (SD)                       58.0 (6.9)           57.1 (6.9)      0.005
                Sex, n (%)
                  Female                                     1,085 (19.7)         139 (26.2)      ≤ 0.001
                Body mass index, mean, (SD)                  28.5 (5.0)           28.3 (5.2)      0.593
                Recipient BMI, Category, n (%)
                  Underweight                                3 (0.1)              0 (0.0)
                  Normal weight                              1,398 (25.3)         137 (25.8)
                  Overweight                                 2,253 (40.8)         227 (42.7)
                  Obesity class I                            1,230 (22.3)         112 (21.1)      0.273
                  Obesity class II                           508 (9.2)            37 (7.0)
                  Obesity class III                          125 (2.3)            18 (3.4)
                Donor BMI, mean, (SD)                        27.6 (5.4)           27.3 (5.6)      0.260
                Presence of renal insufficiency requiring dialysis, n (%)   38 (0.7)   12 (2.3)   ≤ 0.001
                Presence of diabetes, n (%)
                  No                                         3,867 (70.1)         387 (72.9)
                  Type 1 or type 2                           1,600 (29.0)         142 (26.7)      0.226
                  Unknown                                    50 (0.9)             2 (0.4)
                MELD score, mean, (SD)                       12.1 (4.4)           12.1 (5.0)      0.794
                Hospital Stay (day), mean, (SD)              10.5 (13.1)          11.5 (12.1)     0.110
                Months spent on the waiting list, n (%)
                  0-3                                        2,141 (38.8)         229 (43.1)
                  3.1-6                                      1,125 (20.4)         120 (22.6)
                  6.1-12                                     1,142 (20.7)         100 (18.8)      0.022
                  Longer than 12 months                      1,109 (20.1)         82 (15.4)
                Functional status at the time of transplantation, n (%)
                  Less than 60%                              881 (16)             77 (14.5)
                  60% or more                                4,372 (79.2)         423 (79.7)      0.413
                  Unknown                                    264 (4.8)            31 (5.8)
                Education, n (%)
                  Elementary of middle school (grade 1-8)    310 (5.6)            16 (3.0)
                  High school (grade 9-12)                   2,110 (38.3)         223 (42.0)
                  College or technical school                1,251 (22.7)         125 (23.5)
                                                                                                  0.010
                  Associate or bachelor degree               750 (13.6)           55 (10.4)
                  Post college or graduate degree            314 (5.7)            24 (4.5)
                  Unknown                                    781 (14.2)           88 (16.6)
                UNOS region, n (%)
                  Region 1                                   256 (93.4)           18 (6.6)
                  Region 2                                   485 (80.2)           120 (19.8)
                  Region 3                                   804 (90.5)           84 (9.5)
                  Region 4                                   685 (93.3)           49 (6.7)
                  Region 5                                   927 (95.8)           41 (4.2)
                  Region 6                                   295 (98.0)           6 (2.0)         ≤ 0.001
                  Region 7                                   514 (93.6)           35 (9.5)
                  Region 8                                   439 (90.9)           44 (9.1)
                  Region 9                                   382 (90.5)           40 (9.5)
                  Region 10                                  454 (88.7)           58 (11.3)
                  Region 11                                  276 (88.5)           36 (11.5)
                Donors’ age, years, mean, (SD)               44.2 (15.9)          42.6 (16.0)     0.030
                Cold ischemia time, hours, mean, (SD)        6.7 (2.5)            6.6 (2.5)       0.393
               BMI: body mass index

               At univariate Cox regression analysis, ethnicity, age, history of diabetes and functional status at the time of
               transplantation were independent predictors of survival after LT. At multivariate analysis, African American
               ethnicity remained the strongest independent predictor for increased mortality in comparison to Caucasian
   193   194   195   196   197   198   199   200   201   202   203