
Page 168 - Read Online
P. 168
Tamai. Hepatoma Res 2018;4:75 I http://dx.doi.org/10.20517/2394-5079.2018.98 Page 5 of 11
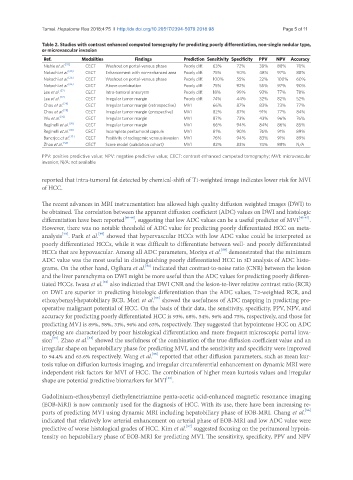
Table 2. Studies with contrast enhanced computed tomography for predicting poorly differentiation, non-single nodular type,
or microvascular invasion
Ref. Modalities Findings Prediction Sensitivity Specificity PPV NPV Accuracy
Nishie et al. [25] CECT Washout on portal-venous phase Poorly diff. 63% 72% 38% 88% 70%
Nakachi et al. [26] CECT Enhancement with non-enhanced area Poorly diff. 75% 90% 48% 97% 88%
Nakachi et al. [26] CECT Washout on portal-venous phase Poorly diff. 100% 55% 22% 100% 60%
Nakachi et al. [26] CECT Above combination Poorly diff. 75% 92% 55% 97% 90%
Lee et al. [27] CECT Intra-tumoral aneurysm Poorly diff. 18% 99% 93% 77% 78%
Lee et al. [27] CECT Irregular tumor margin Poorly diff. 74% 44% 32% 82% 52%
Chou et al. [28] CECT Irregular tumor margin (retrospective) MVI 66% 87% 83% 73% 77%
Chou et al. [28] CECT Irregular tumor margin (prospective) MVI 82% 87% 91% 77% 84%
Wu et al. [31] CECT Irregular tumor margin MVI 87% 73% 43% 96% 76%
Reginelli et al. [30] CECT Irregular tumor margin MVI 66% 94% 84% 86% 85%
Reginelli et al. [30] CECT Incomplete peritumoral capsule MVI 81% 90% 76% 91% 89%
Banerjee et al. [33] CECT Positivity of radiogemic venous invasion MVI 76% 94% 83% 91% 89%
Zhao et al. [34] CECT Score model (validation cohort) MVI 82% 83% 74% 88% N/A
PPV: positive predictive value; NPV: negative predictive value; CECT: contrast enhanced computed tomography; MVI: microvascular
invasion; N/A: not available
reported that intra-tumoral fat detected by chemical-shift of T1-weighted image indicates lower risk for MVI
of HCC.
The recent advances in MRI instrumentation has allowed high quality diffusion weighted images (DWI) to
be obtained. The correlation between the apparent diffusion coefficient (ADC) values on DWI and histologic
differentiation have been reported [40-44] , suggesting that low ADC values can be a useful predictor of MVI [45-47] .
However, there was no notable threshold of ADC value for predicting poorly differentiated HCC on meta-
[48]
[49]
analysis . Park et al. showed that hypervascular HCCs with low ADC value could be interpreted as
poorly differentiated HCCs, while it was difficult to differentiate between well- and poorly differentiated
[50]
HCCs that are hypovascular. Among all ADC parameters, Moriya et al. demonstrated that the minimum
ADC value was the most useful in distinguishing poorly differentiated HCC in 3D analysis of ADC histo-
[51]
grams. On the other hand, Ogihara et al. indicated that contrast-to-noise ratio (CNR) between the lesion
and the liver parenchyma on DWI might be more useful than the ADC values for predicting poorly differen-
[52]
tiated HCCs. Iwasa et al. also indicated that DWI CNR and the lesion-to-liver relative contrast ratio (RCR)
on DWI are superior in predicting histologic differentiation than the ADC values, T2-weighted RCR, and
[53]
ethoxybenzyl-hepatobiliary RCR. Mori et al. showed the usefulness of ADC mapping in predicting pre-
operative malignant potential of HCC. On the basis of their data, the sensitivity, specificity, PPV, NPV, and
accuracy for predicting poorly differentiated HCC is 93%, 68%, 54%, 96% and 75%, respectively, and those for
predicting MVI is 89%, 58%, 31%, 96% and 63%, respectively. They suggested that hypointense HCC on ADC
mapping are characterized by poor histological differentiation and more frequent microscopic portal inva-
[53]
[54]
sion . Zhao et al. showed the usefulness of the combination of the true diffusion coefficient value and an
irregular shape on hepatobiliary phase for predicting MVI, and the sensitivity and specificity were improved
[55]
to 94.4% and 63.6% respectively. Wang et al. reported that other diffusion parameters, such as mean kur-
tosis value on diffusion kurtosis imaging, and irregular circumferential enhancement on dynamic MRI were
independent risk factors for MVI of HCC. The combination of higher mean kurtosis values and irregular
[55]
shape are potential predictive biomarkers for MVI .
Gadolinium-ethoxybenzyl diethylenetriamine penta-acetic acid-enhanced magnetic resonance imaging
(EOB-MRI) is now commonly used for the diagnosis of HCC. With its use, there have been increasing re-
[56]
ports of predicting MVI using dynamic MRI including hepatobiliary phase of EOB-MRI. Chang et al.
indicated that relatively low arterial enhancement on arterial phase of EOB-MRI and low ADC value were
[57]
predictive of worse histological grades of HCC. Kim et al. suggested focusing on the peritumoral hypoin-
tensity on hepatobiliary phase of EOB-MRI for predicting MVI. The sensitivity, specificity, PPV and NPV