
Page 41 - Read Online
P. 41
Lu et al. Hepatoma Res 2018;4:21 I http://dx.doi.org/10.20517/2394-5079.2018.44 Page 3 of 10
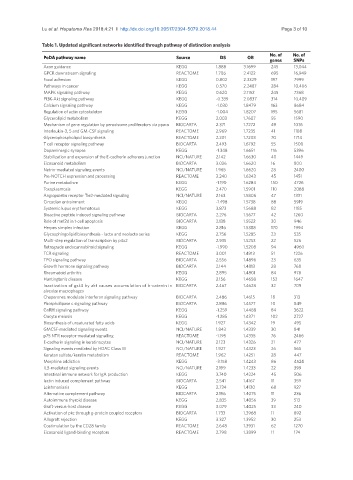
Table 1. Updated significant networks identified through pathway of distinction analysis
No. of No. of
PoDA pathway name Source DS OR genes SNPs
Axon guidance KEGG 1.888 3.1699 245 13,044
GPCR downstream signaling REACTOME 1.706 2.4122 695 16,949
Focal adhesion KEGG 0.802 2.3329 197 7999
Pathways in cancer KEGG 0.570 2.2487 284 10,406
MAPK signaling pathway KEGG 0.620 2.1152 245 7368
PI3K-Akt signaling pathway KEGG -0.339 2.0837 314 10,409
Calcium signaling pathway KEGG -1.030 1.8479 163 8684
Regulation of actin cytoskeleton KEGG -1.004 1.8207 195 5681
Glycerolipid metabolism KEGG 2.003 1.7607 55 1590
Mechanism of gene regulation by peroxisome proliferators via ppara BIOCARTA 2.371 1.7272 49 1076
Interleukin-3, 5 and GM-CSF signaling REACTOME 2.969 1.7235 41 1188
Glycerophospholipid biosynthesis REACTOME 2.201 1.7208 70 1714
T cell receptor signaling pathway BIOCARTA 2.493 1.6792 55 1500
Dopaminergic synapse KEGG -1.348 1.6651 116 5396
Stabilization and expansion of the E-cadherin adherens junction NCI/NATURE 2.142 1.6630 40 1449
Eicosanoid metabolism BIOCARTA 3.026 1.6620 16 800
Netrin-mediated signaling events NCI/NATURE 1.965 1.6620 28 2400
Pre-NOTCH expression and processing REACTOME 3.240 1.6343 45 1451
Purine metabolism KEGG -1.190 1.6284 150 4726
Toxoplasmosis KEGG 2.470 1.5901 110 2088
Angiopoietin receptor Tie2-mediated signaling NCI/NATURE 2.163 1.5806 47 1331
Circadian entrainment KEGG -1.498 1.5738 88 5919
Systemic lupus erythematosus KEGG 3.873 1.5688 82 1185
Bioactive peptide induced signaling pathway BIOCARTA 2.276 1.5677 42 1260
Role of mef2d in t-cell apoptosis BIOCARTA 2.138 1.5522 30 946
Herpes simplex infection KEGG 2.816 1.5388 170 1994
Glycosphingolipid biosynthesis - lacto and neolacto series KEGG 2.756 1.5285 23 535
Multi-step regulation of transcription by pitx2 BIOCARTA 2.935 1.5253 22 526
Retrograde endocannabinoid signaling KEGG -1.990 1.5208 94 4960
TCR signaling REACTOME 3.001 1.4913 51 1226
TPO signaling pathway BIOCARTA 2.556 1.4896 23 635
Growth hormone signaling pathway BIOCARTA 2.144 1.4813 28 768
Rheumatoid arthritis KEGG 2.895 1.4801 84 978
Huntington’s disease KEGG 2.156 1.4658 152 1647
Inactivation of gsk3 by akt causes accumulation of b-catenin in BIOCARTA 2.467 1.4628 32 709
alveolar macrophages
Chaperones modulate interferon signaling pathway BIOCARTA 2.486 1.4615 18 313
Phospholipase c signaling pathway BIOCARTA 2.886 1.4577 10 849
GnRH signaling pathway KEGG -1.259 1.4488 84 3622
Oocyte meiosis KEGG -1.285 1.4371 102 2727
Biosynthesis of unsaturated fatty acids KEGG 1.927 1.4342 19 495
GMCSF-mediated signaling events NCI/NATURE 1.843 1.4339 30 841
p75 NTR receptor-mediated signalling REACTOME -1.195 1.4335 76 2466
E-cadherin signaling in keratinocytes NCI/NATURE 2.123 1.4326 21 477
Signaling events mediated by HDAC Class III NCI/NATURE 1.927 1.4323 26 565
Keratan sulfate/keratin metabolism REACTOME 1.962 1.4251 28 447
Morphine addiction KEGG -3.158 1.4243 86 4524
IL3-mediated signaling events NCI/NATURE 2.199 1.4233 22 399
Intestinal immune network for IgA production KEGG 3.740 1.4224 45 506
lectin induced complement pathway BIOCARTA 2.541 1.4167 11 359
Leishmaniasis KEGG 2.734 1.4130 68 927
Alternative complement pathway BIOCARTA 2.196 1.4075 11 236
Autoimmune thyroid disease KEGG 2.835 1.4056 39 513
Graft-versus-host disease KEGG 3.079 1.4025 33 240
Activation of pkc through g-protein coupled receptors BIOCARTA 1.733 1.3968 11 892
Allograft rejection KEGG 3.327 1.3952 30 253
Costimulation by the CD28 family REACTOME 2.648 1.3931 62 1270
Eicosanoid ligand-binding receptors REACTOME 2.798 1.3899 11 174