
Page 44 - Read Online
P. 44
Page 6 of 10 Lu et al. Hepatoma Res 2018;4:21 I http://dx.doi.org/10.20517/2394-5079.2018.44
2
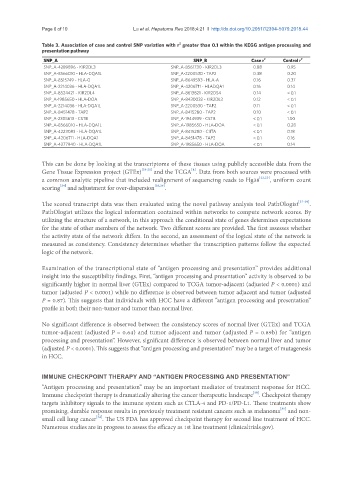
Table 3. Association of case and control SNP variation with r greater than 0.1 within the KEGG antigen processing and
presentation pathway
SNP_A SNP_B Case r 2 Control r 2
SNP_A-4289896 - KIR2DL3 SNP_A-8561730 - KIR2DL3 0.88 0.95
SNP_A-8566010 - HLA-DQA1L SNP_A-2200530 - TAP2 0.38 0.20
SNP_A-8515749 - HLA-G SNP_A-8649593 - HLA-A 0.16 0.37
SNP_A-2214036 - HLA-DQA1L SNP_A-4206711 - HLADQA1 0.16 0.14
SNP_A-8524421 - KIR2DL4 SNP_A-8613821 - KIR2DS4 0.14 < 0.1
SNP_A-1985650 - HLA-DOA SNP_A-8430032 - KIR2DL3 0.12 < 0.1
SNP_A-2214036 - HLA-DQA1L SNP_A-2200530 - TAP2 0.11 < 0.1
SNP_A-8451478 - TAP2 SNP_A-8415280 - TAP2 0.10 < 0.1
SNP_A-2305613 - CSTB SNP_A-1944939 - CSTB < 0.1 1.00
SNP_A-8566010 - HLA-DQA1L SNP_A-1985650 - HLA-DOA < 0.1 0.28
SNP_A-4223083 - HLA-DQA1L SNP_A-8415280 - CIITA < 0.1 0.18
SNP_A-4206711 - HLA-DQA1 SNP_A-8451478 - TAP2 < 0.1 0.16
SNP_A-4277940 - HLA-DQA1L SNP_A-1985650 - HLA-DOA < 0.1 0.14
This can be done by looking at the transcriptome of these tissues using publicly accessible data from the
[8]
Gene Tissue Expression project (GTEx) [19-21] and the TCGA . Data from both sources were processed with
a common analytic pipeline that included realignment of sequencing reads to Hg38 [22,23] , uniform count
[24]
scoring and adjustment for over-dispersion [25,26] .
The scored transcript data was then evaluated using the novel pathway analysis tool PathOlogist [27-29] .
PathOlogist utilizes the logical information contained within networks to compute network scores. By
utilizing the structure of a network, in this approach the conditional state of genes determines expectations
for the state of other members of the network. Two different scores are provided. The first assesses whether
the activity state of the network differs. In the second, an assessment of the logical state of the network is
measured as consistency. Consistency determines whether the transcription patterns follow the expected
logic of the network.
Examination of the transcriptional state of “antigen processing and presentation” provides additional
insight into the susceptibility findings. First, “antigen processing and presentation” activity is observed to be
significantly higher in normal liver (GTEx) compared to TCGA tumor-adjacent (adjusted P < 0.0001) and
tumor (adjusted P < 0.0001) while no difference is observed between tumor adjacent and tumor (adjusted
P = 0.87). This suggests that individuals with HCC have a different “antigen processing and presentation”
profile in both their non-tumor and tumor than normal liver.
No significant difference is observed between the consistency scores of normal liver (GTEx) and TCGA
tumor-adjacent (adjusted P = 0.64) and tumor adjacent and tumor (adjusted P = 0.89b) for “antigen
processing and presentation”. However, significant difference is observed between normal liver and tumor
(adjusted P < 0.0001). This suggests that “antigen processing and presentation” may be a target of mutagenesis
in HCC.
IMMUNE CHECKPOINT THERAPY AND “ANTIGEN PROCESSING AND PRESENTATION”
“Antigen processing and presentation” may be an important mediator of treatment response for HCC.
[30]
Immune checkpoint therapy is dramatically altering the cancer therapeutic landscape . Checkpoint therapy
targets inhibitory signals to the immune system such as CTLA-4 and PD-1/PD-L1. These treatments show
[31]
promising, durable response results in previously treatment resistant cancers such as melanoma and non-
[32]
small cell lung cancer . The US FDA has approved checkpoint therapy for second line treatment of HCC.
Numerous studies are in progress to assess the efficacy as 1st line treatment (clinicaltrials.gov).