
Page 184 - Read Online
P. 184
Page 4 of 18 Seo et al. Energy Mater. 2025, 5, 500123 https://dx.doi.org/10.20517/energymater.2025.38
Figure 1. OM images for the needle/bar-shaped single-crystals of (A) Ca YbZn 4.45 Cu 0.05 Sb , (B) Ca YbZn 4.4 Cu Sb , and (C)
9
8
9
0.1
8
Ca YbZn 4.35 Cu 0.15 Sb . Scale bars are also provided.
9
8
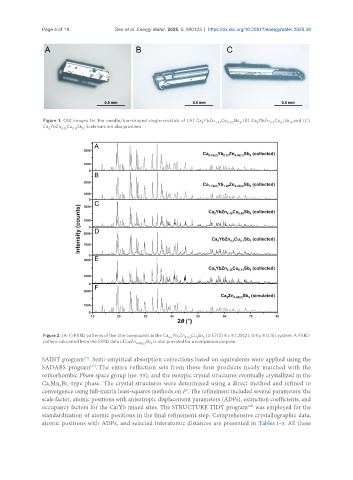
Figure 2. (A-F) PXRD patterns of five title compounds in the Ca Yb Zn Cu Sb (0.57(2) ≤ x ≤ 1.28(2), 0 ≤ y ≤ 0.15) system. A PXRD
9-x x 4.5-y y 9
pattern calculated from the SXRD data of CaZn Sb is also provided for a comparison purpose.
4.48(2) 9
SAINT program . Semi-empirical absorption corrections based on equivalents were applied using the
[21]
[22]
SADABS program . The entire reflection sets from these four products nicely matched with the
orthorhombic Pbam space group (no. 55), and the isotypic crystal structures eventually crystallized in the
Ca Mn Bi -type phase. The crystal structures were determined using a direct method and refined to
4
9
9
convergence using full-matrix least-squares methods on F . The refinement included several parameters: the
2
scale factor, atomic positions with anisotropic displacement parameters (ADPs), extinction coefficients, and
[23]
occupancy factors for the Ca/Yb mixed sites. The STRUCTURE TIDY program was employed for the
standardization of atomic positions in the final refinement step. Comprehensive crystallographic data,
atomic positions with ADPs, and selected interatomic distances are presented in Tables 1-3. All these