
Page 56 - Read Online
P. 56
Page 8 of 17 Li et al. Chem Synth 2023;3:30 https://dx.doi.org/10.20517/cs.2023.16
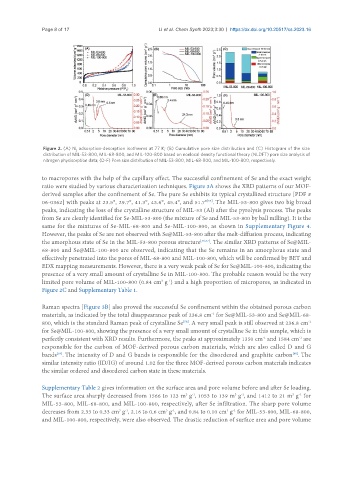
Figure 2. (A) N adsorption-desorption isotherms at 77 K; (B) Cumulative pore size distribution and (C) Histogram of the size
2
distribution of MIL-53-800, MIL-68-800, and MIL-100-800 based on nonlocal density functional theory (NLDFT) pore size analysis of
nitrogen physisorption data; (D-F) Pore size distribution of MIL-53-800, MIL-68-800, and MIL-100-800, respectively.
to macropores with the help of the capillary effect. The successful confinement of Se and the exact weight
ratio were studied by various characterization techniques. Figure 3A shows the XRD patterns of our MOF-
derived samples after the confinement of Se. The pure Se exhibits its typical crystallized structure [PDF #
06-0362] with peaks at 23.5°, 29.7°, 41.3°, 43.6°, 45.4°, and 51.7° . The MIL-53-800 gives two big broad
[55]
peaks, indicating the loss of the crystalline structure of MIL-53 (Al) after the pyrolysis process. The peaks
from Se are clearly identified for Se-MIL-53-800 (the mixture of Se and MIL-53-800 by ball milling). It is the
same for the mixtures of Se-MIL-68-800 and Se-MIL-100-800, as shown in Supplementary Figure 4.
However, the peaks of Se are not observed with Se@MIL-53-800 after the melt-diffusion process, indicating
the amorphous state of Se in the MIL-53-800 porous structure [56,57] . The similar XRD patterns of Se@MIL-
68-800 and Se@MIL-100-800 are observed, indicating that the Se remains in an amorphous state and
effectively penetrated into the pores of MIL-68-800 and MIL-100-800, which will be confirmed by BET and
EDX mapping measurements. However, there is a very weak peak of Se for Se@MIL-100-800, indicating the
presence of a very small amount of crystalline Se in MIL-100-800. The probable reason would be the very
limited pore volume of MIL-100-800 (0.84 cm g ) and a high proportion of micropores, as indicated in
-1
3
Figure 2C and Supplementary Table 1.
Raman spectra [Figure 3B] also proved the successful Se confinement within the obtained porous carbon
materials, as indicated by the total disappearance peak of 236.8 cm for Se@MIL-53-800 and Se@MIL-68-
-1
-1
800, which is the standard Raman peak of crystalline Se . A very small peak is still observed at 236.8 cm
[58]
for Se@MIL-100-800, showing the presence of a very small amount of crystalline Se in this sample, which is
perfectly consistent with XRD results. Furthermore, the peaks at approximately 1350 cm and 1584 cm are
-1
-1
responsible for the carbon of MOF-derived porous carbon materials, which are also called D and G
[60]
bands . The intensity of D and G bands is responsible for the disordered and graphite carbon . The
[59]
similar intensity ratio (ID/IG) of around 1.02 for the three MOF-derived porous carbon materials indicates
the similar ordered and disordered carbon state in these materials.
Supplementary Table 2 gives information on the surface area and pore volume before and after Se loading.
The surface area sharply decreased from 1566 to 123 m g , 1053 to 139 m g , and 1412 to 21 m g for
-1
2
2
-1
2
-1
MIL-53-800, MIL-68-800, and MIL-100-800, respectively, after Se infiltration. The sharp pore volume
decreases from 2.33 to 0.33 cm g , 2.16 to 0.6 cm g , and 0.84 to 0.10 cm g for MIL-53-800, MIL-68-800,
-1
3
-1
3
3
-1
and MIL-100-800, respectively, were also observed. The drastic reduction of surface area and pore volume