
Page 52 - Read Online
P. 52
Cui et al. Complex Eng Syst 2023;3:3 I http://dx.doi.org/10.20517/ces.2022.57 Page 11 of 15
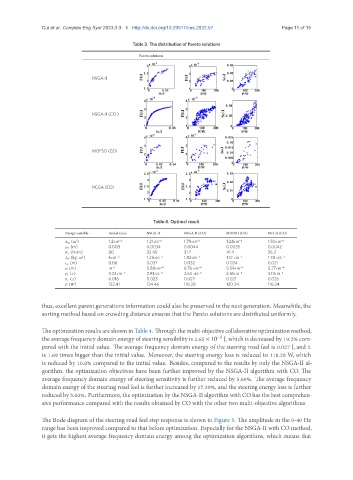
Table 3. The distribution of Pareto solutions
Pareto solutions
NSGA-II
NSGA-II (CO )
MOPSO (CO)
NCGA (CO)
Table 4. Optimal result
Design variable Initial value NSGA-II NSGA-II (CO) MOPSO (CO) NCGA (CO)
(m ) 1.2∗10 −4 1.21∗10 −4 1.79∗10 −4 1.24∗10 −4 1.50∗10 −4
2
(m) 0.008 0.0034 0.0044 0.0035 0.0042
(N/m) 80 32.45 31.7 41.4 36.2
(kg· m ) 6∗10 −3 1.26∗10 −3 1.82∗10 −3 1.12 ∗10 −3 1.78 ∗10 −3
2
(m) 0.06 0.037 0.032 0.034 0.021
(m) 10 −3 5.88∗10 −4 6.76 ∗10 −4 5.59∗10 −4 5.27∗10 −4
( ) 3.24∗10 −5 2.81∗10 −5 2.65 ∗10 −5 2.61∗10 −5 3.13∗10 −5
( ) 0.016 0.023 0.027 0.021 0.026
( ) 132.41 124.46 118.28 120.24 116.34
thus, excellent parent generations information could also be preserved in the next generation. Meanwhile, the
sorting method based on crowding distance ensures that the Pareto solutions are distributed uniformly.
Theoptimizationresultsareshownin Table4. Throughthemulti-objectivecollaborativeoptimizationmethod,
the average frequency domain energy of steering sensibility is 2.65 × 10 J, which is decreased by 19.2% com-
−5
pared with the initial value. The average frequency domain energy of the steering road feel is 0.027 J, and it
is 1.69 times bigger than the initial value. Moreover, the steering energy loss is reduced to 118.28 W, which
is reduced by 10.8% compared to the initial value. Besides, compared to the results by only the NSGA-II al-
gorithm, the optimization objectives have been further improved by the NSGA-II algorithm with CO. The
average frequency domain energy of steering sensitivity is further reduced by 5.69%. The average frequency
domain energy of the steering road feel is further increased by 17.39%, and the steering energy loss is further
reduced by 5.00%. Furthermore, the optimization by the NSGA-II algorithm with CO has the best comprehen-
sive performance compared with the results obtained by CO with the other two multi-objective algorithms.
The Bode diagram of the steering road feel step response is shown in Figure 5. The amplitude in the 0-40 Hz
range has been improved compared to that before optimization. Especially for the NSGA-II with CO method,
it gets the highest average frequency domain energy among the optimization algorithms, which means that