
Page 434 - Read Online
P. 434
Kaima et al. Vessel Plus 2020;4:37 I http://dx.doi.org/10.20517/2574-1209.2020.50 Page 3 of 6
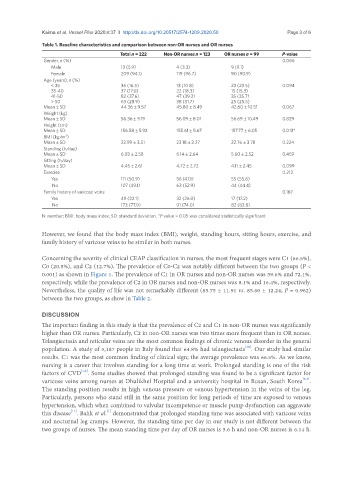
Table 1. Baseline characteristics and comparison between non-OR nurses and OR nurses
Total n = 222 Non-OR nurses n = 123 OR nurses n = 99 P-value
Gender, n (%) 0.066
Male 13 (5.9) 4 (3.3) 9 (9.1)
Female 209 (94.1) 119 (96.7) 90 (90.9)
Age (years), n (%)
< 35 36 (16.5) 13 (10.8) 23 (23.5) 0.094
35-40 37 (17.0) 22 (18.3) 15 (15.3)
41-50 82 (37.6) 47 (39.2) 35 (35.7)
> 50 63 (28.9) 38 (31.7) 25 (25.5)
Mean ± SD 44.36 ± 9.57 45.80 ± 8.49 42.60 ± 10.51 0.067
Weight (kg)
Mean ± SD 56.36 ± 9.19 56.09 ± 8.01 56.69 ± 10.49 0.829
Height (cm)
Mean ± SD 156.58 ± 5.92 155.61 ± 5.67 157.77 ± 6.05 0.013*
2
BMI (kg/m )
Mean ± SD 22.99 ± 3.51 23.18 ± 3.27 22.76 ± 3.78 0.224
Standing (h/day)
Mean ± SD 6.03 ± 2.58 6.14 ± 2.64 5.60 ± 2.52 0.459
Sitting (h/day)
Mean ± SD 4.45 ± 2.61 4.72 ± 2.72 4.11 ± 2.45 0.099
Exercise 0.212
Yes 111 (50.9) 56 (47.1) 55 (55.6)
No 107 (49.1) 63 (52.9) 44 (44.4)
Family history of varicose veins 0.167
Yes 49 (22.1) 32 (26.0) 17 (17.2)
No 173 (77.9) 91 (74.0) 82 (82.8)
N: number; BMI: body mass index; SD: standard deviation. *P value < 0.05 was considered statistically significant
However, we found that the body mass index (BMI), weight, standing hours, sitting hours, exercise, and
family history of varicose veins to be similar in both nurses.
Concerning the severity of clinical CEAP classification in nurses, the most frequent stages were C1 (66.5%),
C0 (20.8%), and C2 (12.7%). The prevalence of C0-C2 was notably different between the two groups (P <
0.001) as shown in Figure 1. The prevalence of C1 in OR nurses and non-OR nurses was 59.6% and 72.1%,
respectively, while the prevalence of C2 in OR nurses and non-OR nurses was 8.1% and 16.4%, respectively.
Nevertheless, the quality of life was not remarkably different (85.75 ± 11.91 vs. 85.60 ± 12.24; P = 0.962)
between the two groups, as show in Table 2.
DISCUSSION
The important finding in this study is that the prevalence of C2 and C1 in non-OR nurses was significantly
higher than OR nurses. Particularly, C2 in non-OR nurses was two times more frequent than in OR nurses.
Telangiectasia and reticular veins are the most common findings of chronic venous disorder in the general
[10]
population. A study of 5,187 people in Italy found that 64.8% had telangiectasia . Our study had similar
results. C1 was the most common finding of clinical sign; the average prevalence was 66.5%. As we know,
nursing is a career that involves standing for a long time at work. Prolonged standing is one of the risk
[1,2]
factors of CVD . Some studies showed that prolonged standing was found to be a significant factor for
[6,7]
varicose veins among nurses at Dhulikhel Hospital and a university hospital in Busan, South Korea .
The standing position results in high venous pressure or venous hypertension in the veins of the leg.
Particularly, persons who stand still in the same position for long periods of time are exposed to venous
hypertension, which when combined to valvular incompetence or muscle pump dysfunction can aggravate
[11]
[1]
this disease . Bahk et al. demonstrated that prolonged standing time was associated with varicose veins
and nocturnal leg cramps. However, the standing time per day in our study is not different between the
two groups of nurses. The mean standing time per day of OR nurses is 5.6 h and non-OR nurses is 6.14 h.