
Page 40 - Read Online
P. 40
Page 4 of 22 Royse et al. Vessel Plus 2020;4:5 I http://dx.doi.org/10.20517/2574-1209.2019.34
Figure 1. Schematic diagram of radial artery Y graft operation. LIMA: left internal mammary artery; RA: radial artery; LAD: left anterior
descending artery; OM: obtuse marginal artery; PDA: posterior descending artery
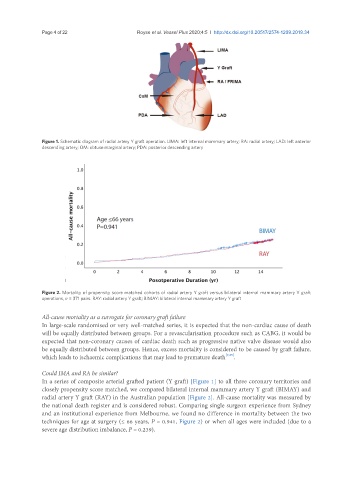
Figure 2. Mortality of propensity score matched cohorts of radial artery Y graft versus bilateral internal mammary artery Y graft
operations, n = 371 pairs. RAY: radial artery Y graft; BIMAY: bilateral internal mammary artery Y graft
All-cause mortality as a surrogate for coronary graft failure
In large-scale randomised or very well-matched series, it is expected that the non-cardiac cause of death
will be equally distributed between groups. For a revascularisation procedure such as CABG, it would be
expected that non-coronary causes of cardiac death such as progressive native valve disease would also
be equally distributed between groups. Hence, excess mortality is considered to be caused by graft failure,
which leads to ischaemic complications that may lead to premature death [7,25] .
Could IMA and RA be similar?
In a series of composite arterial grafted patient (Y graft) [Figure 1] to all three coronary territories and
closely propensity score matched, we compared bilateral internal mammary artery Y graft (BIMAY) and
radial artery Y graft (RAY) in the Australian population [Figure 2]. All-cause mortality was measured by
the national death register and is considered robust. Comparing single surgeon experience from Sydney
and an institutional experience from Melbourne, we found no difference in mortality between the two
techniques for age at surgery (≤ 66 years, P = 0.941, Figure 2) or when all ages were included (due to a
severe age distribution imbalance, P = 0.239).