
Page 85 - Read Online
P. 85
Page 6 of 15 Slattery et al. Neuroimmunol Neuroinflammation 2018;5:11 I http://dx.doi.org/10.20517/2347-8659.2018.05
A B C
40 40 40
Nitrite (µmol/L) 20 Nitrite (µmol/L) 20 Nitrite (µmol/L) 20
30
30
30
10
10
10
0 0 0
0 2 20 50 0 2 20 50 0 2 20 50
Acetaminophen (µmol/L) P-aminophenol (µmol/L) AM404 (µmol/L)
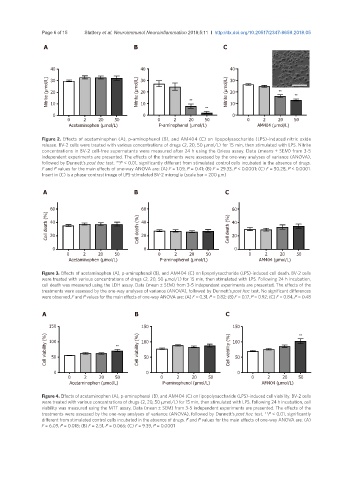
Figure 2. Effects of acetaminophen (A), p-aminophenol (B), and AM404 (C) on lipopolysaccharide (LPS)-induced nitric oxide
release. BV-2 cells were treated with various concentrations of drugs (2, 20, 50 mmol/L) for 15 min, then stimulated with LPS. Nitrite
concentrations in BV-2 cell-free supernatants were measured after 24 h using the Griess assay. Data (means ± SEM) from 3-5
independent experiments are presented. The effects of the treatments were assessed by the one-way analyses of variance (ANOVA),
followed by Dunnett’s post hoc test. **P < 0.01, significantly different from stimulated control cells incubated in the absence of drugs.
F and P values for the main effects of one-way ANOVA are: (A) F = 1.09, P = 0.41; (B) F = 29.33, P < 0.0001; (C) F = 50.28, P < 0.0001.
Insert in (C) is a phase-contrast image of LPS-stimulated BV-2 microglia (scale bar = 200 mm)
A B C
60 60 60
Cell death (%) 40 Cell death (%) 40 Cell death (%) 40
20
20
20
0 0 0
0 2 20 50 0 2 20 50 0 2 20 50
Acetaminophen (µmol/L) P-aminophenol (µmol/L) AM404 (µmol/L)
Figure 3. Effects of acetaminophen (A), p-aminophenol (B), and AM404 (C) on lipopolysaccharide (LPS)-induced cell death. BV-2 cells
were treated with various concentrations of drugs (2, 20, 50 mmol/L) for 15 min, then stimulated with LPS. Following 24 h incubation,
cell death was measured using the LDH assay. Data (mean ± SEM) from 3-5 independent experiments are presented. The effects of the
treatments were assessed by the one-way analyses of variance (ANOVA), followed by Dunnett’s post hoc test. No significant differences
were observed. F and P values for the main effects of one-way ANOVA are: (A) F = 0.31, P = 0.82; (B) F = 0.17, P = 0.92; (C) F = 0.84, P = 0.48
A B C
150 150 150
Cell viability (%) 100 Cell viability (%) 100 Cell viability (%) 100
50
50
50
0 0 0
0 2 20 50 0 2 20 50 0 2 20 50
Acetaminophen (µmol/L) P-aminophenol (µmol/L) AM404 (µmol/L)
Figure 4. Effects of acetaminophen (A), p-aminophenol (B), and AM404 (C) on lipopolysaccharide (LPS)-induced cell viability. BV-2 cells
were treated with various concentrations of drugs (2, 20, 50 mmol/L) for 15 min, then stimulated with LPS. Following 24 h incubation, cell
viability was measured using the MTT assay. Data (mean ± SEM) from 3-5 independent experiments are presented. The effects of the
treatments were assessed by the one-way analyses of variance (ANOVA), followed by Dunnett’s post hoc test. **P < 0.01, significantly
different from stimulated control cells incubated in the absence of drugs. F and P values for the main effects of one-way ANOVA are: (A)
F = 6.09, P = 0.018; (B) F = 2.51, P = 0.066; (C) F = 9.39, P = 0.0001