
Page 35 - Read Online
P. 35
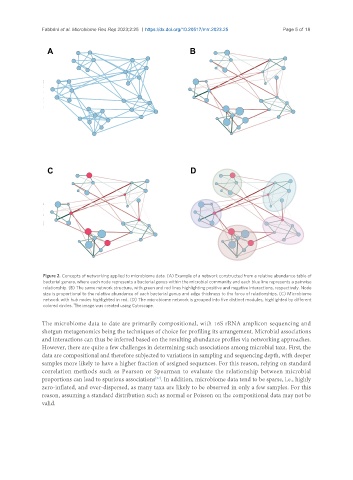
Fabbrini et al. Microbiome Res Rep 2023;2:25  https://dx.doi.org/10.20517/mrr.2023.25  Page 5 of 18


                Figure 2. Concepts of networking applied to microbiome data. (A) Example of a network constructed from a relative abundance table of
                bacterial genera, where each node represents a bacterial genus within the microbial community and each blue line represents a pairwise
                relationship. (B) The same network structure, with green and red lines highlighting positive and negative interactions, respectively. Node
                size is proportional to the relative abundance of each bacterial genus and edge thickness to the force of relationships. (C) Microbiome
                network with hub nodes highlighted in red. (D) The microbiome network is grouped into five distinct modules, highlighted by different
                colored circles. The image was created using Cytoscape.

               The microbiome data to date are primarily compositional, with 16S rRNA amplicon sequencing and
               shotgun metagenomics being the techniques of choice for profiling its arrangement. Microbial associations
               and interactions can thus be inferred based on the resulting abundance profiles via networking approaches.
               However, there are quite a few challenges in determining such associations among microbial taxa. First, the
               data are compositional and therefore subjected to variations in sampling and sequencing depth, with deeper
               samples more likely to have a higher fraction of assigned sequences. For this reason, relying on standard
               correlation methods such as Pearson or Spearman to evaluate the relationship between microbial
               proportions can lead to spurious associations . In addition, microbiome data tend to be sparse, i.e., highly
                                                     [37]
               zero-inflated, and over-dispersed, as many taxa are likely to be observed in only a few samples. For this
               reason, assuming a standard distribution such as normal or Poisson on the compositional data may not be
               valid.