
Page 104 - Read Online
P. 104
Page 6 of 12 Yang et al. Mini-invasive Surg 2021;5:11 I http://dx.doi.org/10.20517/2574-1225.2021.06
Table 3. Anthropometric characteristics and laboratory values for patients with T2DM (stratified by BMI group) using last
observation in Year 1 carried forward
Δ, 0 to 12 mo
BMI Group 0 BMI Group I BMI Group II BMI Group III
Variable 2 2 2 2
(< 23.0 kg/m ) (23.0 to < 27.5 kg/m ) (27.5 to < 32.5 kg/m ) (≥ 32.5 kg/m )
n Mean ± SD n Mean ± SD n Mean ± SD n Mean ± SD
Weight
Weight (%) 1 -13.4 34 -11.8 ± 10.2 28 -16.9 ± 9.8 24 -20.7 ± 16.5
2
BMI (kg/m %) 1 -8.2 31 -12.7 ± 9.4 28 -18.0 ± 9.4 18 -27.1 ± 14.4
Glycemic outcomes
HbA1c (Δ%) 1 -1.7 34 -1.6 ± 2.2 27 -1.9 ± 2.3 24 -2.5 ± 2.1
FBG (mg/dL) 3 -16.9 ± 19.8 35 -51.6 ± 70.0 31 -36.2 ± 78.1 30 -66.8 ± 61.1
Serum lipids
HDL-C (mg/dL) 3 -8.8 ± 4.8 32 6.6 ± 15.2 31 6.5 ± 15.5 28 7.1 ± 10.5
LDL-C (mg/dL) 3 -25.6 ± 14.4 32 -15.5 ± 40.6 31 -21.6 ± 31.4 28 -32.7 ± 29.0
Triglycerides (mg/dL) 3 -31.0 ± 12.9 32 -158.5 ± 393.1 30 -53.5 ± 152.9 28 -123.3 ± 112.2
TC (mg/dL) 3 -36.3 ± 28.2 32 -26.4 ± 59.1 31 -37.7 ± 76.9 28 -41.5 ± 33.7
BMI: Body mass index; FBG: fasting blood glucose; HbA1c: glycosylated hemoglobin; HDL-C: high-density lipoprotein cholesterol; LDL-C:
low-density lipoprotein cholesterol; SD: standard deviation; TC: total cholesterol.
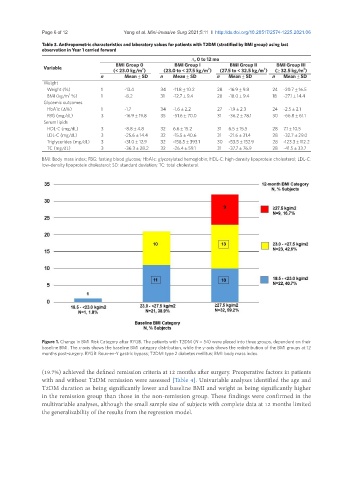
Figure 1. Change in BMI Risk Category after RYGB. The patients with T2DM (N = 54) were placed into three groups, dependent on their
baseline BMI. The x-axis shows the baseline BMI category distribution, while the y-axis shows the redistribution of the BMI groups at 12
months post-surgery. RYGB: Roux-en-Y gastric bypass; T2DM: type 2 diabetes mellitus; BMI: body mass index.
(19.7%) achieved the defined remission criteria at 12 months after surgery. Preoperative factors in patients
with and without T2DM remission were assessed [Table 4]. Univariable analyses identified the age and
T2DM duration as being significantly lower and baseline BMI and weight as being significantly higher
in the remission group than those in the non-remission group. These findings were confirmed in the
multivariable analyses, although the small sample size of subjects with complete data at 12 months limited
the generalizability of the results from the regression model.