
Page 103 - Read Online
P. 103
Yang et al. Mini-invasive Surg 2021;5:11 I http://dx.doi.org/10.20517/2574-1225.2021.06 Page 5 of 12
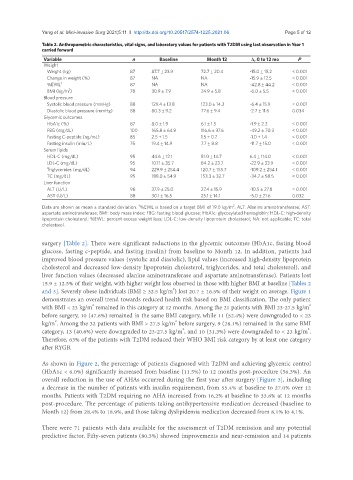
Table 2. Anthropometric characteristics, vital signs, and laboratory values for patients with T2DM using last observation in Year 1
carried forward
Variable n Baseline Month 12 Δ, 0 to 12 mo P
Weight
Weight (kg) 87 87.7 ± 23.9 72.7 ± 20.4 -15.0 ± 15.2 < 0.001
Change in weight (%) 87 NA NA -15.9 ± 12.5 < 0.001
%EWL † 87 NA NA -42.8 ± 44.2 < 0.001
2
BMI (kg/m ) 78 30.9 ± 7.9 24.9 ± 5.8 -6.0 ± 5.5 < 0.001
Blood pressure
Systolic blood pressure (mmHg) 88 129.4 ± 13.8 123.0 ± 14.3 -6.4 ± 15.9 < 0.001
Diastolic blood pressure (mmHg) 88 80.3 ± 9.2 77.6 ± 9.4 -2.7 ± 11.6 0.034
Glycemic outcomes
HbA1c (%) 87 8.0 ± 1.9 6.1 ± 1.5 -1.9 ± 2.2 < 0.001
FBG (mg/dL) 100 165.8 ± 64.9 116.6 ± 37.6 -49.2 ± 70.3 < 0.001
Fasting C-peptide (ng/mL) 85 2.5 ± 1.5 1.5 ± 0.7 -1.0 ± 1.4 < 0.001
Fasting insulin (miu/L) 75 19.4 ± 14.9 7.7 ± 8.8 -11.7 ± 15.0 < 0.001
Serum lipids
HDL-C (mg/dL) 95 44.6 ± 12.1 51.0 ± 14.7 6.4 ± 114.0 < 0.001
LDL-C (mg/dL) 95 107.1 ± 35.7 84.2 ± 23.7 -22.9 ± 33.9 < 0.001
Triglycerides (mg/dL) 94 229.9 ± 254.4 120.7 ± 155.7 -109.2 ± 254.1 < 0.001
TC (mg/dL) 95 188.0 ± 54.9 153.3 ± 32.7 -34.7 ± 58.5 < 0.001
Liver function
ALT (U/L) 96 37.9 ± 25.0 27.4 ± 15.9 -10.5 ± 27.8 < 0.001
AST (U/L) 88 30.1 ± 16.5 25.1 ± 14.1 -5.0 ± 21.6 0.032
2
†
Data are shown as mean ± standard deviation. %EWL is based on a target BMI of 19.0 kg/m . ALT: Alanine aminotransferase; AST:
aspartate aminotransferase; BMI: body mass index; FBG: fasting blood glucose; HbA1c: glycosylated hemoglobin; HDL-C: high-density
lipoprotein cholesterol; %EWL: percent excess weight loss; LDL-C: low-density lipoprotein cholesterol; NA: not applicable; TC: total
cholesterol.
surgery [Table 2]. There were significant reductions in the glycemic outcomes (HbA1c, fasting blood
glucose, fasting c-peptide, and fasting insulin) from baseline to Month 12. In addition, patients had
improved blood pressure values (systolic and diastolic), lipid values (increased high-density lipoprotein
cholesterol and decreased low-density lipoprotein cholesterol, triglycerides, and total cholesterol), and
liver function values (decreased alanine aminotransferase and aspartate aminotransferase). Patients lost
15.9 ± 12.5% of their weight, with higher weight loss observed in those with higher BMI at baseline [Tables 2
2
and 3]. Severely obese individuals (BMI ≥ 32.5 kg/m ) lost 20.7 ± 16.5% of their weight on average. Figure 1
demonstrates an overall trend towards reduced health risk based on BMI classification. The only patient
2
2
with BMI < 23 kg/m remained in this category at 12 months. Among the 21 patients with BMI 23-27.5 kg/m
before surgery, 10 (47.6%) remained in the same BMI category, while 11 (52.4%) were downgraded to < 23
2
2
kg/m . Among the 32 patients with BMI > 27.5 kg/m before surgery, 9 (28.1%) remained in the same BMI
2
2
category, 13 (40.6%) were downgraded to 23-27.5 kg/m , and 10 (31.3%) were downgraded to < 23 kg/m .
Therefore, 63% of the patients with T2DM reduced their WHO BMI risk category by at least one category
after RYGB.
As shown in Figure 2, the percentage of patients diagnosed with T2DM and achieving glycemic control
(HbA1c < 6.0%) significantly increased from baseline (11.5%) to 12 months post-procedure (56.3%). An
overall reduction in the use of AHAs occurred during the first year after surgery [Figure 3], including
a decrease in the number of patients with insulin requirement, from 55.4% at baseline to 27.0% over 12
months. Patients with T2DM requiring no AHA increased from 16.2% at baseline to 33.8% at 12 months
post-procedure. The percentage of patients taking antihypertensive medication decreased (baseline to
Month 12) from 28.4% to 18.9%, and those taking dyslipidemia medication decreased from 8.1% to 4.1%.
There were 71 patients with data available for the assessment of T2DM remission and any potential
predictive factor. Fifty-seven patients (80.3%) showed improvements and near-remission and 14 patients